Fig. 2.
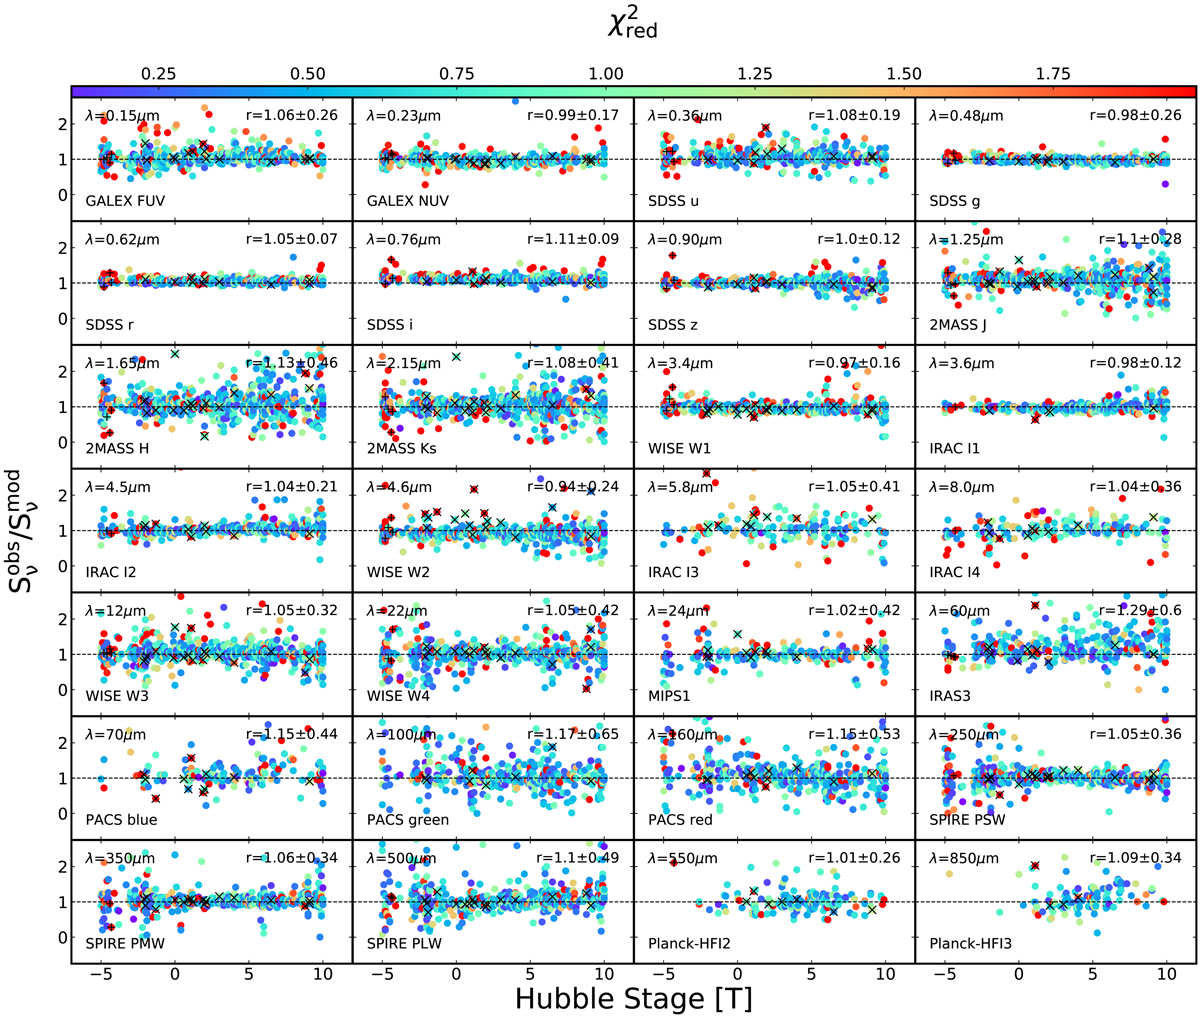
Ratios of the observed fluxes to the modeled (CIGALE) fluxes at specific wavelengths, from the FUV (0.15 μm) to the submm (850 μm), as a function of Hubble stage (T). The wavelength indication (in μm) is given in the top-left corner of each panel, and the name of the survey/band is provided in the bottom-left corner. The ratios are color-coded with the ![]() of the fit as indicated in the color-bar at the top of the plot. Galaxies hosting an AGN or strong radio-jets are marked with an “X” or a “+” respectively. In the top-right corner of each panel, the mean value of the ratio and the standard-deviation are also provided.
of the fit as indicated in the color-bar at the top of the plot. Galaxies hosting an AGN or strong radio-jets are marked with an “X” or a “+” respectively. In the top-right corner of each panel, the mean value of the ratio and the standard-deviation are also provided.
Current usage metrics show cumulative count of Article Views (full-text article views including HTML views, PDF and ePub downloads, according to the available data) and Abstracts Views on Vision4Press platform.
Data correspond to usage on the plateform after 2015. The current usage metrics is available 48-96 hours after online publication and is updated daily on week days.
Initial download of the metrics may take a while.