Fig. A.1.
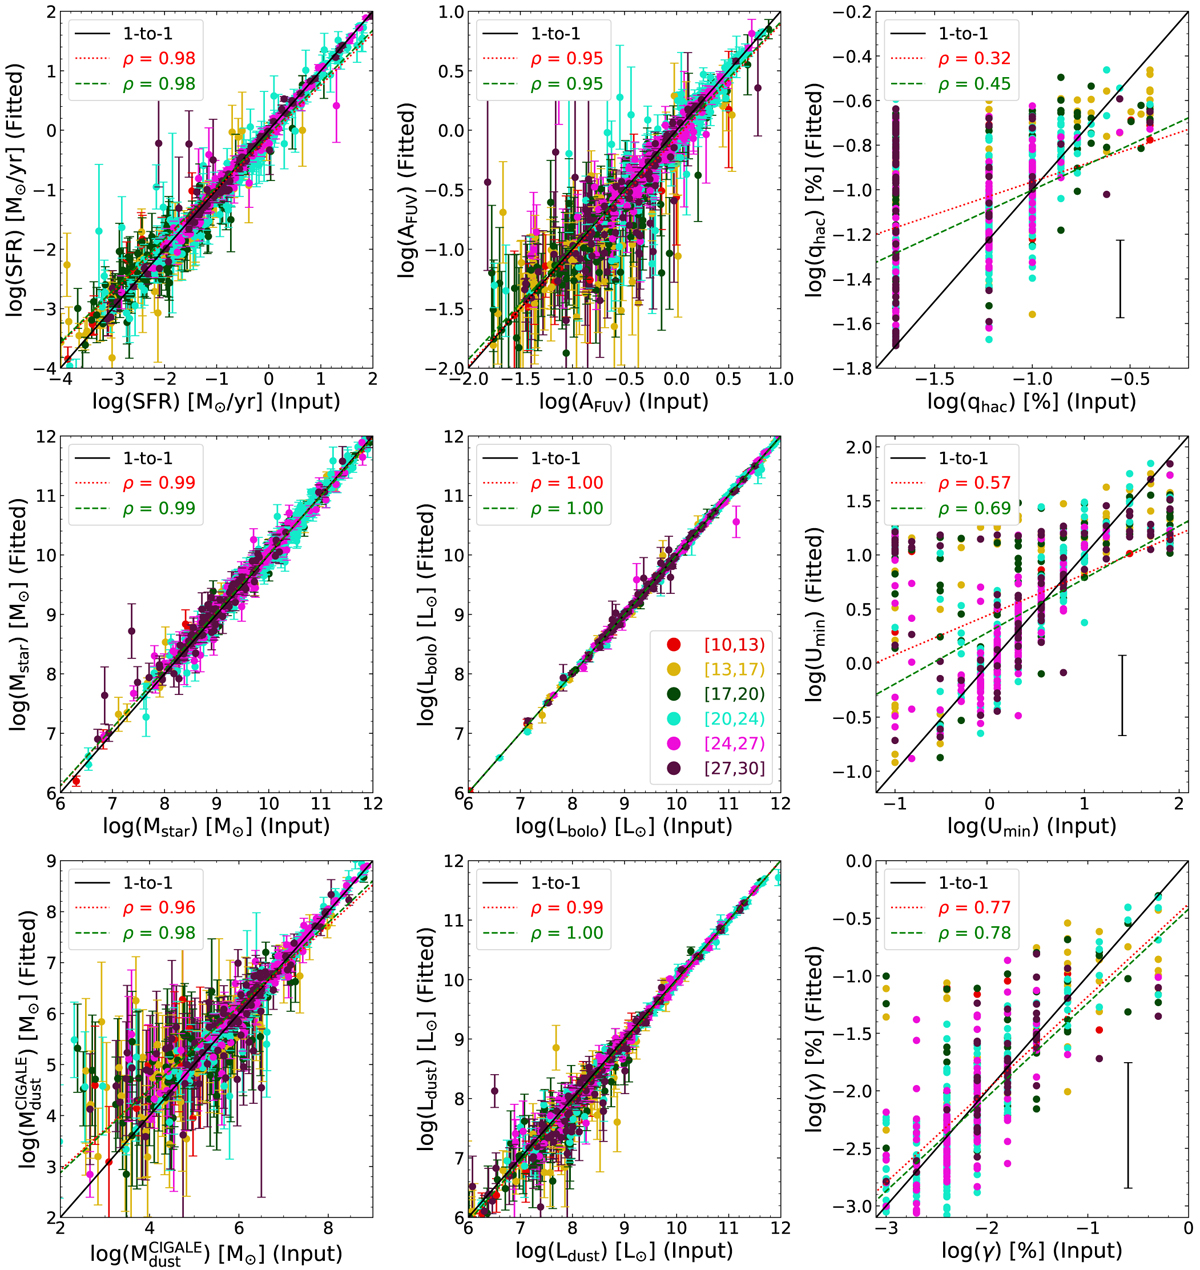
Comparison between the best fitted parameters (input values; x-axis) and the mock parameters (fitted values; y-axis) estimated from the CIGALE fitted PDFs for each parameter (SFR, AFUV, qhac, Mstar, Lbolo, Umin, ![]() , Ldust, and γ, from top to bottom). For each galaxy the probability-weighted mean value along with the associated standard deviation of the mock values (error bars) are plotted on the y-axis. In the cases of qhac, Umin, and γ, the average standard deviation is plotted in the bottom-right corner of each panel in order to avoid confusion. The data are color-coded with the number of observations available for each galaxy (see the inset of the panel in the middle for the explanation of the colors). The solid black line is the one-to-one relation, the red dotted line is the linear regression to the full set of data, while the green dashed line is the linear regression to the galaxies with more than 20 observations available. The Spearman’s coefficient (ρ) of the linear regression fits is also provided in each panel.
, Ldust, and γ, from top to bottom). For each galaxy the probability-weighted mean value along with the associated standard deviation of the mock values (error bars) are plotted on the y-axis. In the cases of qhac, Umin, and γ, the average standard deviation is plotted in the bottom-right corner of each panel in order to avoid confusion. The data are color-coded with the number of observations available for each galaxy (see the inset of the panel in the middle for the explanation of the colors). The solid black line is the one-to-one relation, the red dotted line is the linear regression to the full set of data, while the green dashed line is the linear regression to the galaxies with more than 20 observations available. The Spearman’s coefficient (ρ) of the linear regression fits is also provided in each panel.
Current usage metrics show cumulative count of Article Views (full-text article views including HTML views, PDF and ePub downloads, according to the available data) and Abstracts Views on Vision4Press platform.
Data correspond to usage on the plateform after 2015. The current usage metrics is available 48-96 hours after online publication and is updated daily on week days.
Initial download of the metrics may take a while.