Fig. 10.
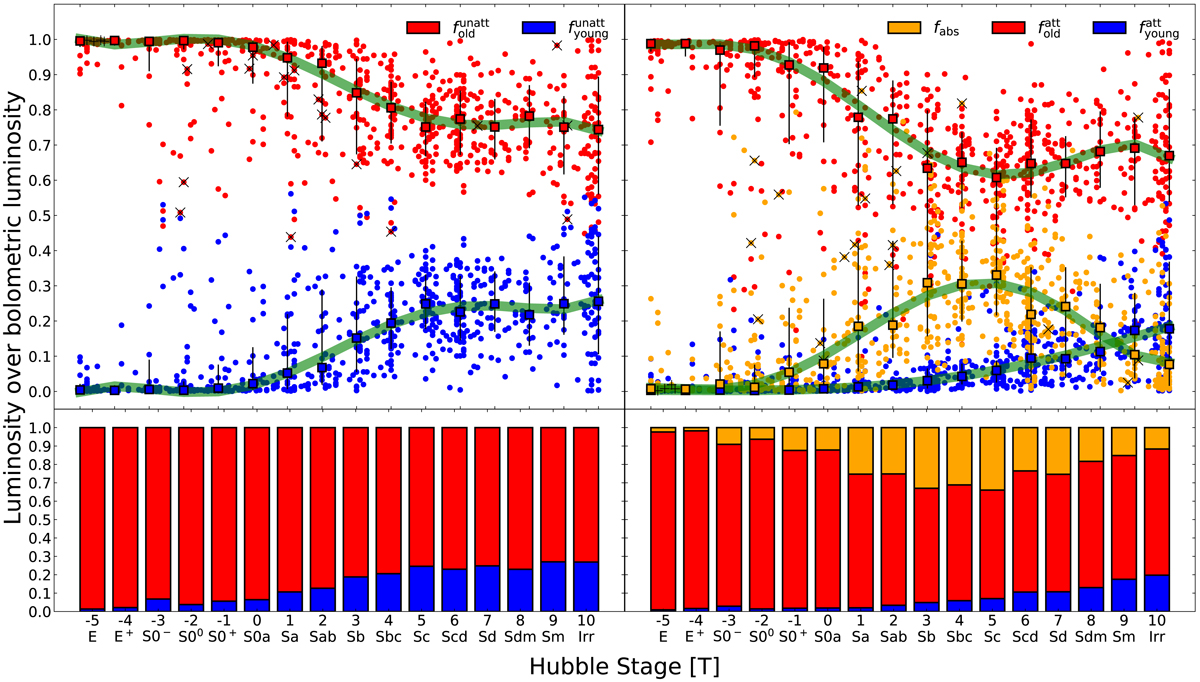
Left panel: ratio of the unattenuated luminosity of the old and the young stellar components to the bolometric luminosity (red and blue circles, respectively; top-left panel) along with the respective stacked-bar plots of the mean values (bottom-left panel). Right panel: ratio of the attenuated luminosity of the old and the young stellar components to the bolometric luminosity (red and blue circles, respectively) together with the ratio of the dust luminosity to the bolometric luminosity (orange circles; top-right panel) along with the respective stacked-bar plots of the mean values (bottom-right panel). Square symbols in the top panels are the median values for a specific Hubble stage bin while the bars indicate the 16th and 84th percentiles range. The thick green curves are the fifth-order polynomial regression to the median values (see Table D.1 for the polynomial regression parameters). Galaxies hosting an AGN or strong radio jets are marked with an “X” or a “+”, respectively, for the old stellar population only (red circles) in the top-left panel, and for the dust luminosity only (orange circles) in the top-right panel.
Current usage metrics show cumulative count of Article Views (full-text article views including HTML views, PDF and ePub downloads, according to the available data) and Abstracts Views on Vision4Press platform.
Data correspond to usage on the plateform after 2015. The current usage metrics is available 48-96 hours after online publication and is updated daily on week days.
Initial download of the metrics may take a while.