Fig. 9.
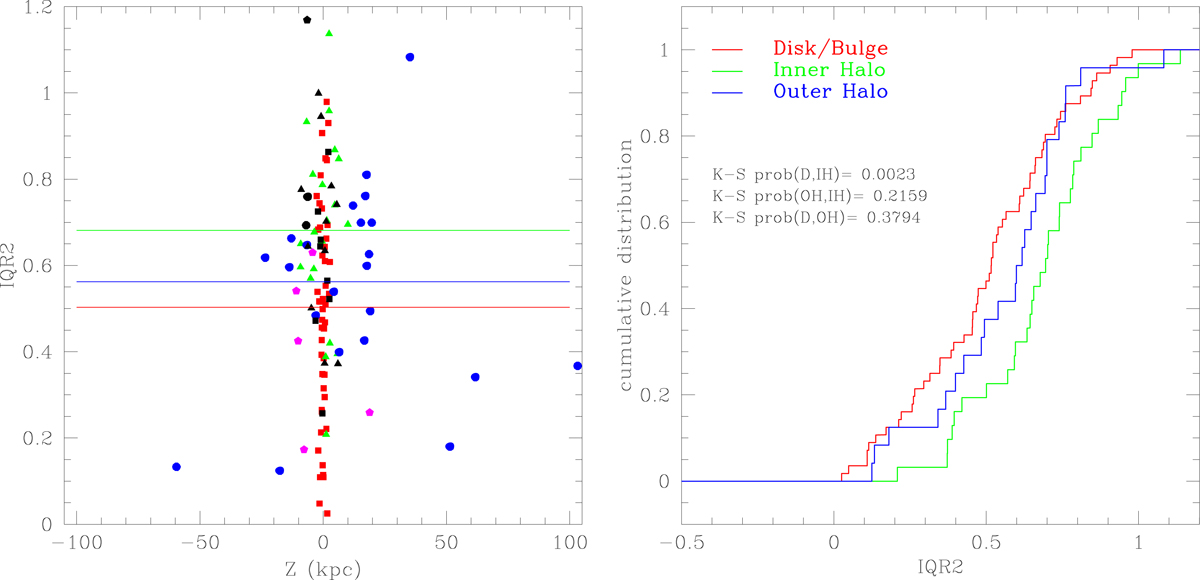
Left panel: calibrated IQR2 values as a function of the distance in kpc from the Galactic plane (H10). Horizontal lines are traced at the average values of the corresponding galactic populations (same colour coding). Right panel: cumulative distribution of IQR2 for GCs of different sub-populations. The P values from two-sample Kolmogorov–Smirnov (K–S) tests are indicated.
Current usage metrics show cumulative count of Article Views (full-text article views including HTML views, PDF and ePub downloads, according to the available data) and Abstracts Views on Vision4Press platform.
Data correspond to usage on the plateform after 2015. The current usage metrics is available 48-96 hours after online publication and is updated daily on week days.
Initial download of the metrics may take a while.