Free Access
Fig. 5.
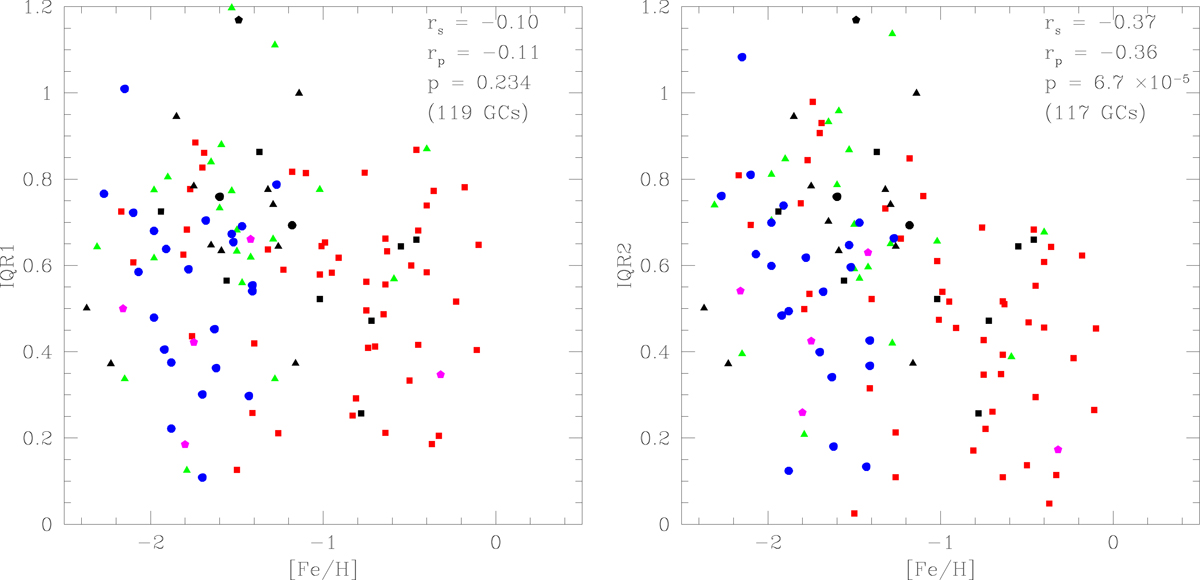
Extensions of the Na–O anti-correlation IQR1 (left panel) and IQR2 (right panel) from the calibrations Eqs. (1) and (2), respectively. Symbols are as in Fig. 2. Black points indicate the calibrating GCs from our FLAMES survey, and their shape indicate the Galactic sub-population. Symbols and label are as in Fig. 4.
Current usage metrics show cumulative count of Article Views (full-text article views including HTML views, PDF and ePub downloads, according to the available data) and Abstracts Views on Vision4Press platform.
Data correspond to usage on the plateform after 2015. The current usage metrics is available 48-96 hours after online publication and is updated daily on week days.
Initial download of the metrics may take a while.