Fig. 2.
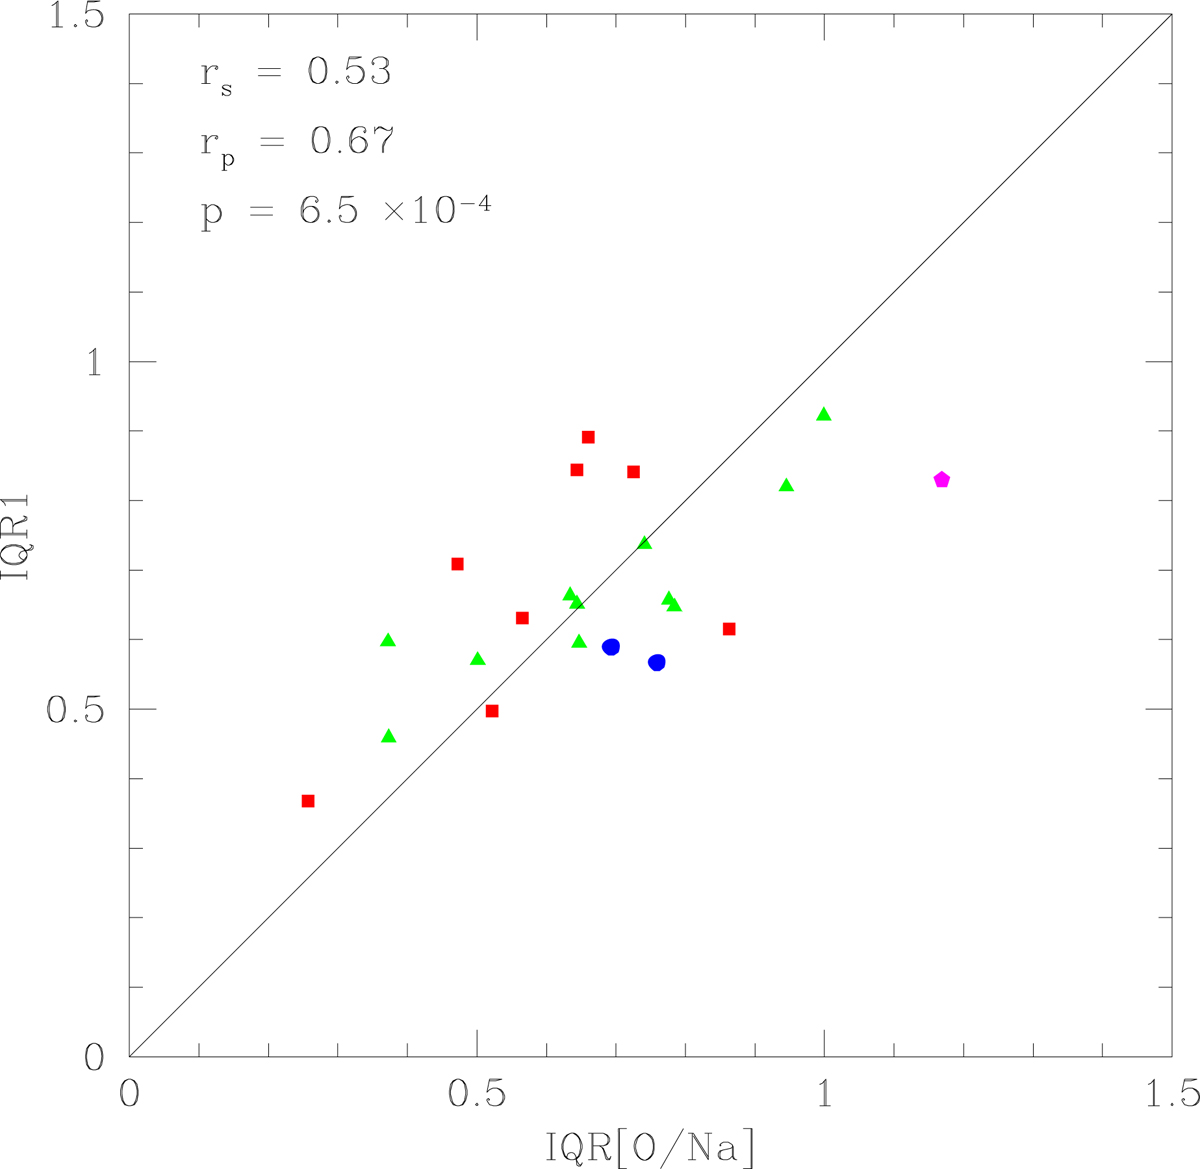
Comparison of the IQR1 values from the first calibration (Eq. (1)) with the observed values IQR[O/Na] for 22 calibrating GCs. The Spearman rank correlation (rS) coefficient, the Pearson linear correlation (rP) coefficients and its p-value are listed in the panel. Different symbols individuate different Galactic populations (see text).
Current usage metrics show cumulative count of Article Views (full-text article views including HTML views, PDF and ePub downloads, according to the available data) and Abstracts Views on Vision4Press platform.
Data correspond to usage on the plateform after 2015. The current usage metrics is available 48-96 hours after online publication and is updated daily on week days.
Initial download of the metrics may take a while.