Free Access
Fig. 13.
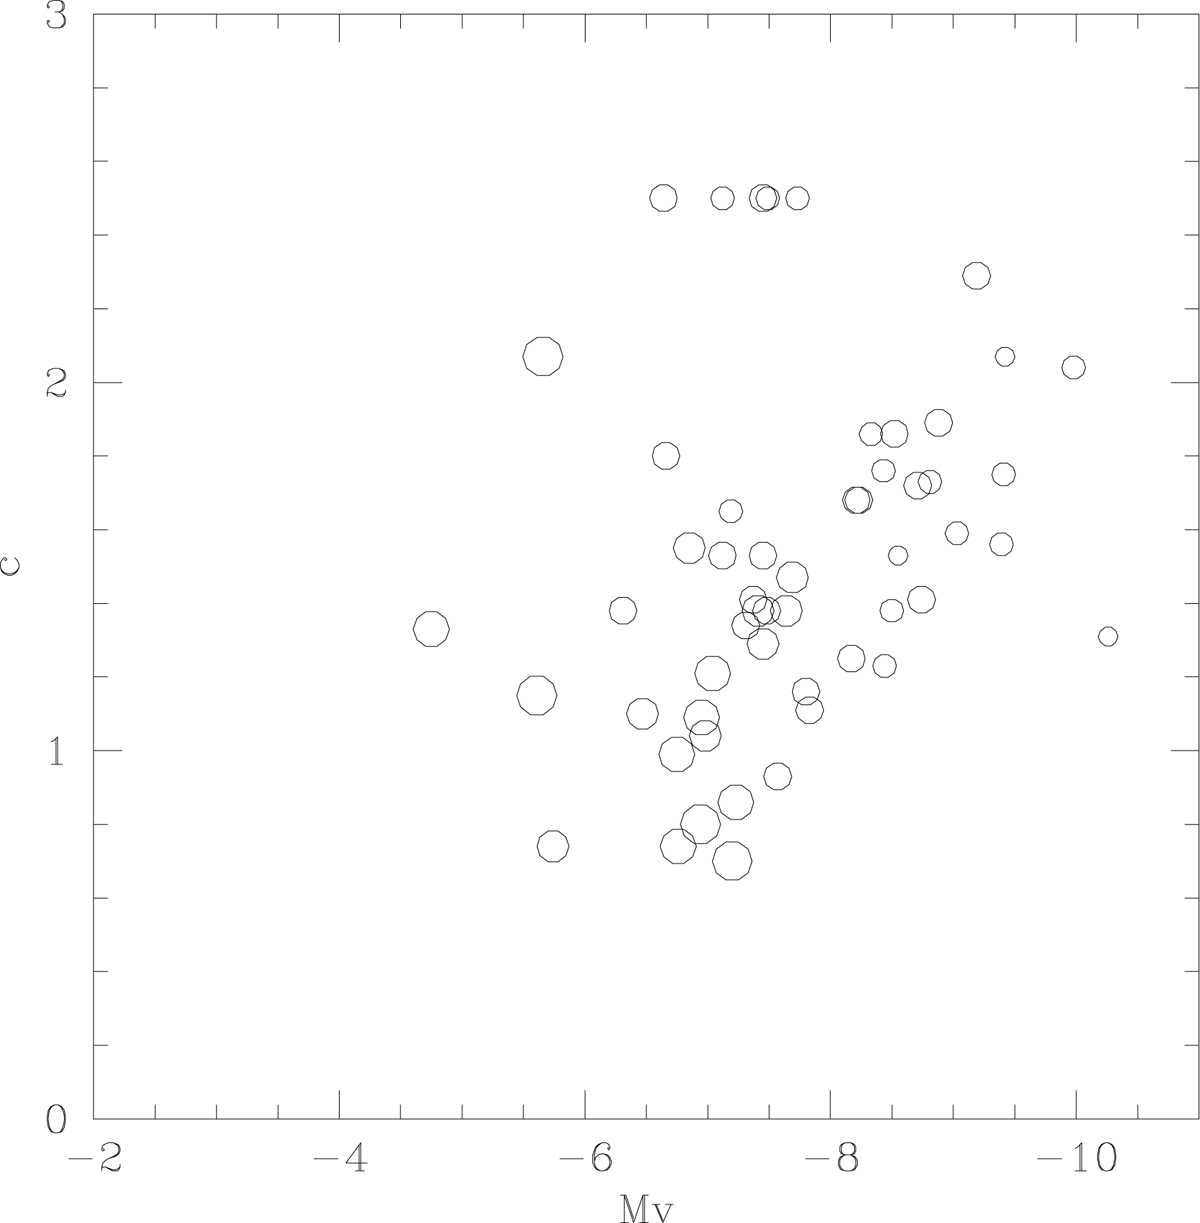
Correlation between concentration and luminosity for Galactic GCs, where are only plotted GCs with fraction of FG stars estimated in Milone et al. (2017) from HST photometry. Symbol sizes are proportional to the fractions, in steps of 10% from about 10 to about 70%.
Current usage metrics show cumulative count of Article Views (full-text article views including HTML views, PDF and ePub downloads, according to the available data) and Abstracts Views on Vision4Press platform.
Data correspond to usage on the plateform after 2015. The current usage metrics is available 48-96 hours after online publication and is updated daily on week days.
Initial download of the metrics may take a while.