Fig. 11.
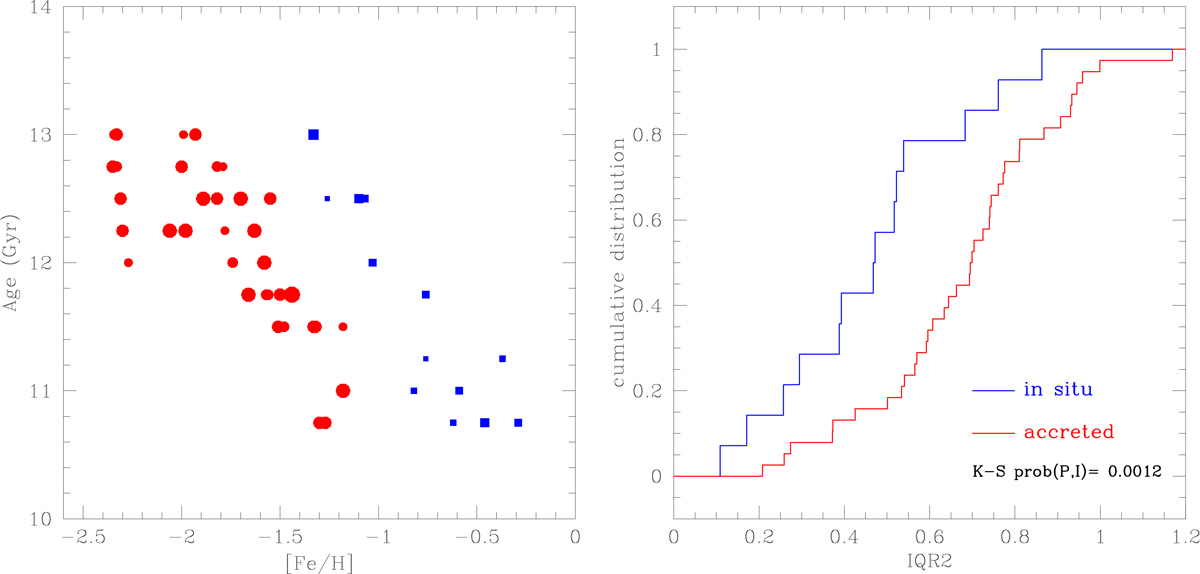
Left panel: age–metallicity relation from Leaman et al. (2013) for GCs formed in situ in the MW disc (blue points) and GCs likely formed in smaller stellar systems and later accreted in the MW (red points). The size of the symbols are proportional to the IQR2 values. Right panel: cumulative distributions of GCs with different origin. The P value from two-sample K–S tests is indicated.
Current usage metrics show cumulative count of Article Views (full-text article views including HTML views, PDF and ePub downloads, according to the available data) and Abstracts Views on Vision4Press platform.
Data correspond to usage on the plateform after 2015. The current usage metrics is available 48-96 hours after online publication and is updated daily on week days.
Initial download of the metrics may take a while.