| Issue |
A&A
Volume 624, April 2019
|
|
|---|---|---|
| Article Number | A74 | |
| Number of page(s) | 8 | |
| Section | Atomic, molecular, and nuclear data | |
| DOI | https://doi.org/10.1051/0004-6361/201935075 | |
| Published online | 12 April 2019 | |
Plasma environment effects on K lines of astrophysical interest
I. Atomic structure, radiative rates, and Auger widths of oxygen ions
1
Physique Atomique et Astrophysique, Université de Mons – UMONS, 7000 Mons, Belgium
e-mail: This email address is being protected from spambots. You need JavaScript enabled to view it.
2
Department of Physics, Western Michigan University, Kalamazoo, MI 49008, USA
3
Helmholtz Institut Jena, 07743 Jena, Germany
4
Theoretisch Physikalisches Institut, Friedrich Schiller Universität Jena, 07743 Jena, Germany
5
Cahill Center for Astronomy and Astrophysics, California Institute of Technology, Pasadena, CA 91125, USA
6
Dr. Karl Remeis-Observatory and Erlangen Centre for Astroparticle Physics, Sternwartstr. 7, 96049 Bamberg, Germany
7
NASA Goddard Space Flight Center, Code 662, Greenbelt, MD 20771, USA
8
IPNAS, Université de Liège, Sart Tilman, 4000 Liège, Belgium
Received:
17
January
2019
Accepted:
4
March
2019
Abstract
Aims. In the context of black-hole accretion disks, the main goal of the present study is to estimate the plasma environment effects on the atomic structure and radiative parameters associated with the K-vacancy states in ions of the oxygen isonuclear sequence.
Methods. We used a time-averaged Debye–Hückel potential for both the electron–nucleus and the electron–electron interactions implemented in the fully relativistic multiconfiguration Dirac–Fock (MCDF) method.
Results. Modified ionization potentials, K thresholds, Auger widths, and radiative transition wavelengths and rates are reported for O I–O VII in plasma environments with electron temperature and density ranges 105−107 K and 1018−1022 cm−3.
Key words: black hole physics / plasmas / atomic data / X-rays: general
© ESO 2019
1. Introduction
High-density plasma effects (free–free heating at electron densities ne > 1019 cm−3) may explain the apparent supersolar Fe abundances inferred from the X-ray spectra of accreting black holes (García et al. 2018). However, the currently available atomic data to model astronomical spectra do not take into account high-density effects, and are therefore limited to densities below 1018 cm−3 (García et al. 2016). In regard to this, Schnittman et al. (2013) recently carried out magnetohydrodynamic (MHD) simulations of a 10 M⊙ black hole accreting at a 10% rate, and predicted plasma conditions in the accretion disk characterized by electron temperatures and densities spanning the ranges 105−107 K and 1018−1022 cm−3. Fields et al. (2007) have determined supersolar abundances for carbon, nitrogen, oxygen, and iron from a high-resolution Chandra spectrum of the warm absorbing gas outflowing from the active galactic nucleus (AGN) Mrk 279 compact region, where especially the oxygen abundance is estimated at approximately eight times solar. This latter environment type is also expected to have densities greater than 1019 cm−3.
García et al. (2005) reported a complete set of atomic data relevant to the modeling of oxygen K lines formed in astrophysical photoionized plasmas. As underlined by Smith & Brickhouse (2014) in the interpretation of X-ray spectra taken by current space observatories, none of these atomic parameters take into account high-density plasma embedding, where the atomic structure and processes (e.g., emissivities, opacities, and ionization balance) could be significantly distorted by the extreme temperature and density.
In the present study we provide a complete set of structure and radiative data for the modeling of oxygen K lines that include plasma environment effects. In Sect. 2, we describe the atomic physics computational approach, and in Sect. 3 we validate the time-averaged potential used to model the plasma environment by means of three test cases. In Sect. 4 we discuss in detail our results, and finally our conclusions are drawn in Sect. 5.
2. Theoretical approach
In the multiconfiguration Dirac–Fock (MCDF) method (Grant et al. 1980; McKenzie et al. 1980; Grant 1988) the atomic state function (ASF) Ψ is represented by a linear combination of configuration state functions (CSF) Φ of the same parity (P), total angular momentum (J), and angular-momentum projection (M)
 (1)
(1)
where the CSFs are antisymmetrized products of orthonormal monoelectronic spin-orbitals of the form
 (2)
(2)
In Eq. (2) Pnκ(r) and Qnκ(r) are the large and small radial orbitals, respectively, and the angular functions χκm(θ, ϕ) are spinor spherical harmonics. These spin-orbitals are optimized self-consistently based on the Dirac–Coulomb Hamiltonian
 (3)
(3)
For an atom embedded in a weakly coupled plasma, the Hamiltonian of Eq. (3) is replaced with the Debye–Hückel (DH) screened Dirac–Coulomb Hamiltonian (Saha & Fritzsche 2006)
 (4)
(4)
where rij = |ri − rj| and the plasma screening parameter μ is the inverse of the Debye shielding length λD, which can be expressed in atomic units (au) as a function of the plasma electron density ne and temperature Te as
 (5)
(5)
Typical plasma conditions in black-hole accretion disks are Te ∼ 105−107 K and ne ∼ 1018−1022 cm−3 (Schnittman et al. 2013). For weakly coupled plasmas they correspond to screening parameters 0.0 ≤ μ ≤ 0.24 au and, for a completely ionized hydrogen plasma (with plasma ionization Z* = 1), to plasma coupling parameters
 (6)
(6)
with
 (7)
(7)
in the range 0.0003 ≤ Γ ≤ 0.6.
The last term of Eq. (4) has the angular dependence (Saha & Fritzsche 2006)
 (8)
(8)
where r> = max(ri, rj), r< = min(ri, rj), jl is a Bessel function,  denotes a Hankel function of the first kind, and Pl is a Legendre polynomial that depends on the angle ωij between the two position vectors ri and rj. This screening reduces the electron–electron repulsion and, hence, increases the binding of the electron by the nucleus.
We use the active space (AS) method to obtain the MCDF expansions of Eq. (1) for O I–O VII, whereby electrons from reference configurations are excited to a given active set of orbitals. For these oxygen ions, the AS was built up by considering all the single and double excitations of the reference configurations listed for each species in Table 1 to configurations including n = 2 and n = 3 orbitals.
Reference configurations used to build up the MCDF active space for O I–O VII.
In the isolated atom approximation, the relativistic orbitals Pnκ(r) and Qnκ(r), along with the expansion coefficients ci in Eqs. (1)–(2), were optimized using the GRASP2K package (Parpia et al. 1996) with the extended average level (EAL) option, where the (2J + 1)-weighted trace of the Dirac–Coulomb Hamiltonian (see Eq. (3)) is minimized to determine energy levels, wavelengths, and radiative and Auger rates. To take into account core-relaxation effects on the K-vacancy states (García et al. 2005), we introduce non-orthogonal orbitals optimized separately in two distinct level groups: a first group of exclusively valence levels where the K shell is full; and a second group of levels with at least a single K-vacancy. For the ionization potential (IP) and K threshold, the orbitals were respectively optimized on the ground level and on the lowest K-vacancy level of each ion using the optimal level (OL) option of GRASP2K.
Plasma effects are included perturbatively in a second step where we use the RATIP code of Fritzsche (2012) to improve the expansion coefficients, that is, the ASF, energy levels, and radiative rates, by solving the secular equation with the Debye–Hückel screened Dirac–Coulomb Hamiltonian (Eq. (4)), the two-body Breit interaction, and the quantum electrodynamic corrections (self-energy and vacuum polarization). Plasma screening parameters in the range 0.00 ≤ μ ≤ 0.25 au were adopted, the upper-limit choice, justified in Sect. 3.3, corresponding to the extreme plasma conditions found in accretion disks.
3. Validation of the Debye–Hückel model potential
Stark shifts of the dipole-allowed spectral lines emitted by an ion in a dense plasma have been measured. In a semi-classical picture, neighboring electrons and ions give rise to effective microscopic electric fields that result in level energy shifts due to induced dipole moments in the emitting ion. Alternatively, Stark shifts can also be predicted quantum-mechanically with a Debye–Hückel potential (Rozsnyai 1975). To test the validity of our Debye–Hückel model potential, we performed a series of calculations with the GRASP2K/RATIP code to compare with available laboratory Stark shifts. Such comparisons are common pratice (see, e.g., Rozsnyai 1975; Neiger & Griem 1976, and more recently Belkhiri et al. 2015). The three test cases investigated are detailed in the following Sects. 3.1–3.3.
3.1. Stark shifts in valence transitions of O II
Djenize et al. (1998) measured Stark shifts for the valence-shell transitions  (λ4641.81) and 2p23s 4P1/2–
 (λ4638.85) in O II, respectively as 0.03 ± 0.02 Å and 0.05 ± 0.02 Å, at a temperature Te = 54 000 K and density ne = 2.8 × 1017 cm−3. To reproduce these shifts theoretically, we considered intravalence and core–valence correlations up to n = 5 to represent the respective ASFs in the two transitions. The MCDF shifts obtained with μ = 0.0017 au are both 0.05 Å in good agreement with experiments. Moreover, if the DH screening of the electron–electron Coulomb potential is switched off (i.e., μ = 0 in the last term of Eq. (4)), these shifts become much larger: 0.26 Å and 0.25 Å, respectively. This results confirm that the DH electron–electron plasma screening cannot be neglected. It should be also emphasized that Djenize et al. (1998) compared their measurements with the semi-classical calculations of Griem (1974) and Dimitrijević (1982) (see multiplet No. 1 in their Fig. 4). The three sets of Stark shifts (Djenize et al. 1998; Griem 1974; Dimitrijević 1982) disagree to each other, with the theoretical values having opposite signs and being about ∼0.15 Å (Griem 1974) and ∼−0.05 Å (Dimitrijević 1982). In that respect, our time-independent quantum model confirms the measurements of Djenize et al. (1998).
3.2. Stark shifts in valence transitions of Na I
The Stark shifts of the valence-shell Na I D doublet at 5889.95/5895.90 Å were measured in a plasma with Te = 38 000 K and ne = 3.5 × 1017 cm−3 (Sreckovic et al. 1996), resulting in 0.38 ± 0.09 Å and 0.41 ± 0.09 Å, respectively. Our MCDF calculations with μ = 0.0023 au including both intravalence and core–valence correlations (n ≤ 4) give 0.43 Å and 0.51 Å, respectively, in satisfactory agreement with experiments. Again, if the electron–electron screening is neglected, the MCDF shifts are very different, at 4.42 Å and 4.50 Å.
3.3. Ti Kα line pressure shift
Our last test case concerns the Kα line  of He-like Ti XXI at 4749.73 eV. Khattak et al. (2012) measured a line shift of 3.4 ± 1.0 eV, and inferred an electron temperature greater than ∼3 keV and an electron density exceeding 1024 cm−3 from a hydrodynamic simulation of their laser-produced plasma. This experimental shift was then reproduced theoretically using an ion-sphere model by Belkhiri et al. (2015) leading to an estimate of 3.4 eV at Te = 3 keV and ne = 4.2 × 1024 cm−3. In the same plasma conditions adopted by Belkhiri et al. (2015), namely μ = 0.27 au, our MCDF-DH model yields a line shift of 3.3 eV in good agreement with both the measurements and the ion-sphere calculation. We are therefore confident to consider plasma parameters up to μ = 0.27 au.
4. Results and discussion
In the following Sects. 4.1–4.3 we examine the DH plasma screening effects on the oxygen K-line characteristics by considering screening parameters in the range 0 ≤ μ ≤ 0.25 au, which, as shown in Table 2, can be associated to electron temperatures and densities in the ranges 105 ≤ Te ≤ 107 K and 1018 ≤ ne ≤ 1022 cm−3.
Plasma screening parameter μ (au) for different electron temperatures Te and densities ne.
4.1. Ionization potentials and K thresholds
The IPs (E0) and K thresholds (EK) for O ions determined with MCDF for three values of the plasma screening parameter – μ = 0, 0.1 and 0.25 au – are listed in Tables 3–4. For isolated species (μ = 0), the National Institute of Standards and Technology (NIST) IPs (Kramida et al. 2016) are reproduced to within 1% except for O I, for which only a 4% accuracy was attained due to the well-known slow convergence of the CI expansion (Eq. (1)) for neutrals. As expected, a substantial reduction of the absolute values of E0 and EK increasing with μ is obtained. For the case of μ = 0.1, we show in Table 3 that, if the electron–electron DH screening is neglected (μ = 0 in the last term of Eq. (4)), the continuum lowering, particularly for the low ionized species, is much larger yielding an unphysical negative IP for O I. We therefore stress again that the DH electron–electron screening is essential.
Plasma screening effects on the IP E0(μ) in oxygen ions determined with the MCDF method.
Plasma screening effects on the K threshold EK(μ) in oxygen ions computed with MCDF.
In Fig. 1 we plot the trends of the IP lowering ΔE0(μ) = E0(μ)−E0(μ = 0) with Zeff = Z − N + 1, which are found to be practically linear except for Zeff = 7 (O VII) due to the absence of the DH electron–electron screening. We also include for each species the DH limit  as Γ → 0 determined by Stewart & Pyatt (1966) and Crowley (2014). For O VII,
  close to the MCDF IP lowering for μ = 0.25.
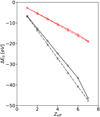 |
Fig. 1. IP lowering ΔE0 = E0(μ)−E0(μ = 0) as function of the effective ionic charge Zeff = Z − N + 1 for two different values of μ. Circles: MCDF calculations. Triangles: DH limit (ΔE0 = −Zeff μ). Red: μ = 0.1 au. Black: μ = 0.25 au. The broken trends observed for Zeff = 7 (O VII) in MCDF calculations are due to the absence of electron–electron plasma screening in the ground state of O VIII that contributes to the ionization potentials of O VII. |
K-threshold lowering (ΔEK(μ) = EK(μ)−EK(μ = 0)) trends with Zeff are very similar to those of ΔE0 as shown in Fig. 2, a predominantly linear decrease up to ΔEK ≈ ΔE0 ≈ −50 eV. This finding is significant inasmuch as the DH screened photoionization cross sections will only involve approximately constant downward energy shifts of the thresholds leading to resonance series truncations rather than variant line wavelengths and resonance energy positions, points that are further discussed in Sects. 4.2–4.3.
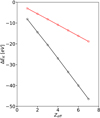 |
Fig. 2. MCDF K-threshold lowering ΔEK = EK(μ)−EK(μ = 0) as function of the effective charge Zeff = Z − N + 1 for two different values of μ. Red: μ = 0.1 au. Black: μ = 0.25 au. |
4.2. Radiative data
Oxygen K-line wavelengths and transition probabilities (A-values) computed with MCDF with μ = 0, 0.1 and 0.25 au are reported in Table A.1. For isolated systems (μ = 0) our radiative data are in good general accord with the pseudo-relativistic Hartree–Fock (HFR) and multiconfiguration Breit–Pauli (MCBP) results of García et al. (2005); more precisely, present K-line wavelengths are shorter by 0.1% for the highly charged ions to little less than 1% for the lower ionization stages. In addition, they are in excellent agreement with the few spectroscopic reports available; for example, for the strong Kα line in O VII, our predicted wavelength agrees within 0.2% with the measurement by Engström & Litzén (1995), and within 0.7% and 0.2% with those reported by Schmidt et al. (2004) for O V and O VI, respectively. Regarding radiative rates, our MCDF results agree with García et al. (2005) on average to within 10% except for a few weak transitions.
Plasma effects on the radiative parameters are found to be small for μ = 0.1 au but more conspicuous for μ = 0.25 au (see Fig. 3). In fact for μ = 0.25 au. K-line wavelengths appear to be shifted by ∼50−100 mÅ with respect to the isolated atom (μ = 0) with a trend increasing with the ion effective charge Zeff as shown in Fig. 3 (upper panel). Although small, such wavelength shifts can be resolved by present and next-generation satellite-borne X-ray spectrometers. The transition probabilities are generally also slightly modified; for instance, they are reduced on average by 5% with μ = 0.25 au (see lower panel of Fig. 3), which would make negligible differences in astrophysical modeling.
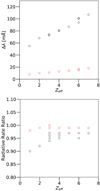 |
Fig. 3. Top panel: MCDF wavelength pressure shift Δλ = λ(μ)−λ(μ = 0) for oxygen K lines as function of the effective charge Zeff = Z − N + 1 for two different values of μ. Bottom panel: MCDF radiative rate ratio A(j, i, μ)/A(j, i, μ = 0) for oxygen K lines as function of the effective charge Zeff = Z − N + 1 for two different values of μ. Red: μ = 0.1 au. Black: μ = 0.25 au. |
4.3. K-vacancy level energies and Auger widths
Multiconfiguration Dirac–Fock level energies and Auger widths for oxygen K-vacancy levels are presented for μ = 0, 0.1 and 0.25 au in Table A.2. Our MCDF energies for μ = 0 au are slightly lower (∼0.5% on average) with respect to those computed with the HFR and MCBP by García et al. (2005), and our Auger widths are on average shorter by ∼25% and ∼20%, respectively. Level-energy decrements are in general found to be small (|ΔE|≲3.0 eV) as illustrated in Fig. 4 (top panel) for μ = 0.1 au and μ = 0.25 au with trends increasing with Zeff. Regarding the Auger widths as shown in Fig. 4 (bottom panel), they are reduced on average by up to ∼10% for μ = 0.25 au, which might have an impact on spectral K-line modeling. Neutral oxygen (Zeff = 1) has a different situation where MCDF predicts a 20% decrease for μ = 0.25 au. This may illustrate the difficulty our atomic structure model has in computing accurate rates (better than 20%) at the neutral end of an isonuclear sequence.
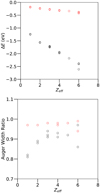 |
Fig. 4. Top panel: MCDF level-energy pressure shift ΔE = E(μ)−E(μ = 0) for oxygen K-vacancy levels as function of the effective charge Zeff = Z − N + 1 for two different values of μ. Bottom panel: MCDF Auger-width ratio Aa(j, μ)/Aa(j, μ = 0) for oxygen K-vacancy levels as function of the effective charge Zeff = Z − N + 1 for two different values of μ. Red: μ = 0.1 au. Black: μ = 0.25 au. |
5. Summary and conclusions
We have studied plasma embedding effects on the atomic structure of oxygen ions, namely the K-shell radiative parameters and Auger widths, as a function of the screening parameter. Such plasma effects were modeled perturbatively in the MCDF framework with a time-independent DH potential. Our main findings and conclusions can be summarized as follows:
-
The validity of our DH model has been benchmarked with Stark line-shift measurements (Sreckovic et al. 1996; Djenize et al. 1998; Khattak et al. 2012) for screening parameters as large as μ = 0.27 au. The latter value has been associated with the extreme density conditions found in accretion disks around compact objects (see Table 2 and García et al. 2016). To obtain the desirable degree of agreement with experiments, the DH electron–electron screening must be taken into account.
-
We have studied plasma screening effects for μ ≤ 0.25 au finding considerable lowering (up to ∼50 eV) of both the IPs and K thresholds. Such shifts could arguably enhance the ionization fractions and K-vacancy state populations or, at least, lead to erroneous spectral line identifications.
-
Only a modest impact on the radiative and Auger data has been detected for μ ≤ 0.1 au, but it becomes more acute under the extreme plasma conditions of μ = 0.25 au: K-line wavelengths are systematically redshifted by up to ∼0.1 Å with potential consequences on out- and inflow velocity determinations; and Auger rates might decrease by up to ∼20% in O I.
-
These new atomic data will be incorporated into the atomic the database of the XSTAR modeling code (Bautista & Kallman 2001) for future spectral analysis of accretion disks around compact objects.
-
We believe the perturbative approach adopted here for μ ≤ 0.25 is well supported by the relatively small effects on and smooth trends found in the atomic parameters, as well as by the good agreement with the experimentally determined Stark shifts for a few ionic species. More extreme conditions may require a non-perturbative inclusion of the DH potential; this work is underway and will be the subject of a subsequent report.
Acknowledgments
JD is a Research Fellow of the Belgian Fund for Research in Industry and Agriculture FRIA. PP & PQ are, respectively, Research Associate and Research Director of the Belgian Fund for Scientific Research F.R.S. –FNRS. Financial support from these organizations, as well as from the NASA Astrophysics Research and Analysis Program (grant 80NSSC17K0345) is gratefully acknowledged. We are indebted to Professor Nigel R. Badnell (Strathclyde University, UK) for lengthy and useful discussions on the validity of the Debye –Hückel potential and its implementations in atomic structure calculations. JAG acknowledges support from the Alexander von Humboldt Foundation.
References
- Bautista, M. A., & Kallman, T. R. 2001, ApJS, 134, 139 [NASA ADS] [CrossRef] [Google Scholar]
- Belkhiri, M., Fontes, C. J., & Poirier, M. 2015, Phys. Rev. A, 92, 032501 [NASA ADS] [CrossRef] [Google Scholar]
- Crowley, B. J. B. 2014, High Energ. Dens. Phys., 13, 84 [Google Scholar]
- Djenize, S., Milosavljevic, V., & Sreckovic, A. 1998, J. Quant. Spectr. Rad. Trans., 59, 71 [Google Scholar]
- Dimitrijević, M. S. 1982, A&A, 112, 51 [NASA ADS] [Google Scholar]
- Engström, L., & Litzén, U. 1995, J. Phys. B: At. Mol. Opt. Phys., 28, 2565 [Google Scholar]
- Fields, D. J., Mathur, S., Krongold, Y., Williams, R., & Nicastro, F. 2007, ApJ, 666, 828 [NASA ADS] [CrossRef] [Google Scholar]
- Fritzsche, S. 2012, Comput. Phys. Commun., 183, 1523 [NASA ADS] [CrossRef] [Google Scholar]
- García, J., Mendoza, C., Bautista, M. A., Gorczyca, T. W., Kallman, T. R., & Palmeri, P. 2005, ApJS, 158, 68 [NASA ADS] [CrossRef] [Google Scholar]
- García, J., Fabian, A. C., Kallman, T. R., et al. 2016, MNRAS, 462, 751 [NASA ADS] [CrossRef] [Google Scholar]
- García, J., Kallman, T. R., Bautista, M., et al. 2018, ASP Conf. Ser., 515, 282 [NASA ADS] [Google Scholar]
- Grant, I. P. 1988, Meth. Comput. Chem., 2, 1 [Google Scholar]
- Grant, I. P., McKenzie, B. J., Norrington, P. H., Mayers, D. F., & Pyper, N. C. 1980, Comput. Phys. Commun., 21, 207 [NASA ADS] [CrossRef] [Google Scholar]
- Griem, H. R. 1974, Spectral Line Broadening by Plasmas (Academic Press: New York) [Google Scholar]
- Khattak, F. Y., Percie du Sert, O. A. M. B., Rosmej, F. B., & Riley, D. 2012, J. Phys. Conf. Ser., 397, 012020 [CrossRef] [Google Scholar]
- Kramida, A., Ralchenko, Yu, Reader, J., & NIST ASD Team 2016, NIST Atomic Spectra Database (version 5.4) Available: http://physics.nist.gov/asd [Tue Oct 03 2017]. National Institute of Standards and Technology, Gaithersburg, MD [Google Scholar]
- McKenzie, B. J., Grant, I. P., & Norrington, P. H. 1980, Comput. Phys. Commun., 21, 233 [NASA ADS] [CrossRef] [Google Scholar]
- Neiger, M., & Griem, H. R. 1976, Phys. Rev. A, 14, 291 [NASA ADS] [CrossRef] [Google Scholar]
- Parpia, F. A., Froese Fischer, C., & Grant, I. P. 1996, Comput. Phys. Commun., 94, 249 [NASA ADS] [CrossRef] [Google Scholar]
- Rozsnyai, B. 1975, J. Quant. Spectr. Rad. Transf., 15, 695 [NASA ADS] [CrossRef] [Google Scholar]
- Saha, B., & Fritzsche, S. 2006, Phys. Rev. E, 73, 036405 [NASA ADS] [CrossRef] [Google Scholar]
- Schmidt, M., Beiersdorfer, P., Chen, H., Thorn, D. B., Träbert, E., & Behar, E. 2004, ApJ, 604, 562 [NASA ADS] [CrossRef] [Google Scholar]
- Schnittman, J. D., Krolik, J. H., & Noble, S. C. 2013, ApJ, 769, 156 [NASA ADS] [CrossRef] [Google Scholar]
- Smith, R. K., & Brickhouse, N. S. 2014, Adv. At. Mol. Opt. Phys., 63, 271 [NASA ADS] [CrossRef] [Google Scholar]
- Sreckovic, A., Djenize, S., & Bukvic, S. 1996, Phys. Scr., 53, 54 [NASA ADS] [CrossRef] [Google Scholar]
- Stewart, J. C., & Pyatt, Jr., K. D. 1966, ApJ, 144, 1203 [NASA ADS] [CrossRef] [Google Scholar]
Appendix A: Additional tables.
Plasma environment effects on the wavelengths and transition probabilities of Kα lines in oxygen ions computed with MCDF.
Plasma environment effects on the energy and Auger widths of K-vacancy states in oxygen ions computed with MCDF.
All Tables
Plasma screening parameter μ (au) for different electron temperatures Te and densities ne.
Plasma screening effects on the IP E0(μ) in oxygen ions determined with the MCDF method.
Plasma screening effects on the K threshold EK(μ) in oxygen ions computed with MCDF.
Plasma environment effects on the wavelengths and transition probabilities of Kα lines in oxygen ions computed with MCDF.
Plasma environment effects on the energy and Auger widths of K-vacancy states in oxygen ions computed with MCDF.
All Figures
|
Fig. 1. IP lowering ΔE0 = E0(μ)−E0(μ = 0) as function of the effective ionic charge Zeff = Z − N + 1 for two different values of μ. Circles: MCDF calculations. Triangles: DH limit (ΔE0 = −Zeff μ). Red: μ = 0.1 au. Black: μ = 0.25 au. The broken trends observed for Zeff = 7 (O VII) in MCDF calculations are due to the absence of electron–electron plasma screening in the ground state of O VIII that contributes to the ionization potentials of O VII. |
| In the text | |
|
Fig. 2. MCDF K-threshold lowering ΔEK = EK(μ)−EK(μ = 0) as function of the effective charge Zeff = Z − N + 1 for two different values of μ. Red: μ = 0.1 au. Black: μ = 0.25 au. |
| In the text | |
|
Fig. 3. Top panel: MCDF wavelength pressure shift Δλ = λ(μ)−λ(μ = 0) for oxygen K lines as function of the effective charge Zeff = Z − N + 1 for two different values of μ. Bottom panel: MCDF radiative rate ratio A(j, i, μ)/A(j, i, μ = 0) for oxygen K lines as function of the effective charge Zeff = Z − N + 1 for two different values of μ. Red: μ = 0.1 au. Black: μ = 0.25 au. |
| In the text | |
|
Fig. 4. Top panel: MCDF level-energy pressure shift ΔE = E(μ)−E(μ = 0) for oxygen K-vacancy levels as function of the effective charge Zeff = Z − N + 1 for two different values of μ. Bottom panel: MCDF Auger-width ratio Aa(j, μ)/Aa(j, μ = 0) for oxygen K-vacancy levels as function of the effective charge Zeff = Z − N + 1 for two different values of μ. Red: μ = 0.1 au. Black: μ = 0.25 au. |
| In the text | |
Current usage metrics show cumulative count of Article Views (full-text article views including HTML views, PDF and ePub downloads, according to the available data) and Abstracts Views on Vision4Press platform.
Data correspond to usage on the plateform after 2015. The current usage metrics is available 48-96 hours after online publication and is updated daily on week days.
Initial download of the metrics may take a while.