Fig. 4.
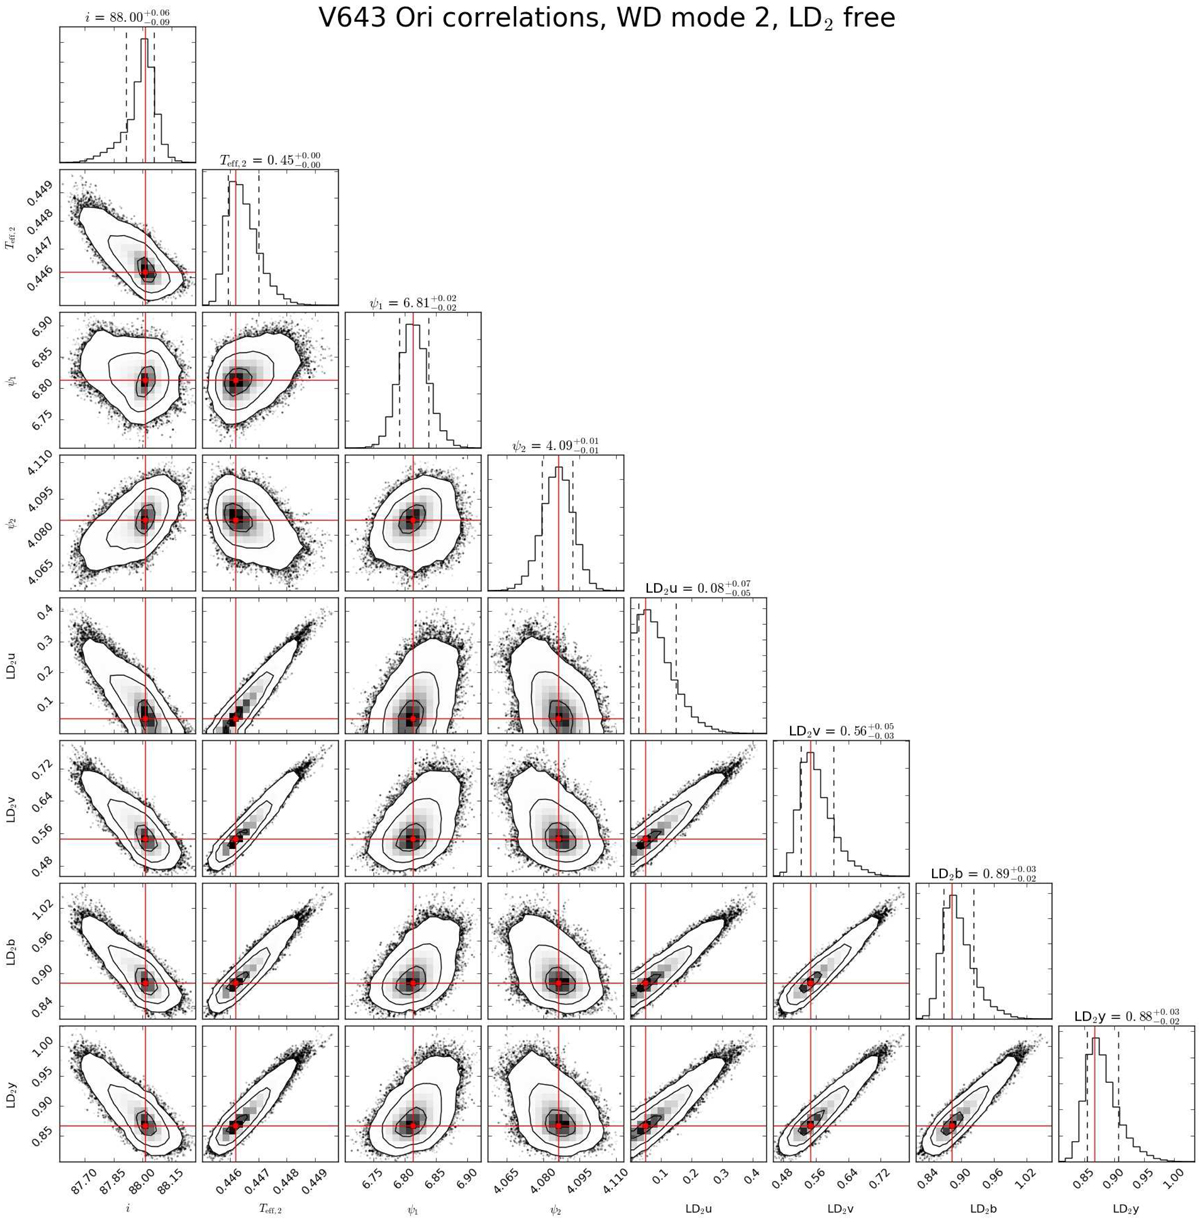
“Corner plot” (source code available at https://github.com/dfm/corner.py, Foreman-Mackey 2016) for V643 Ori, illustrating the correlations among the main fit parameters of our solution. Contour levels correspond to 1, 2, and 3σ, and the histograms on the diagonal represent the posterior distribution for each parameter, with the mode and internal 68% confidence levels indicated. More realistic errors are discussed in the text.
Current usage metrics show cumulative count of Article Views (full-text article views including HTML views, PDF and ePub downloads, according to the available data) and Abstracts Views on Vision4Press platform.
Data correspond to usage on the plateform after 2015. The current usage metrics is available 48-96 hours after online publication and is updated daily on week days.
Initial download of the metrics may take a while.