Fig. 6.
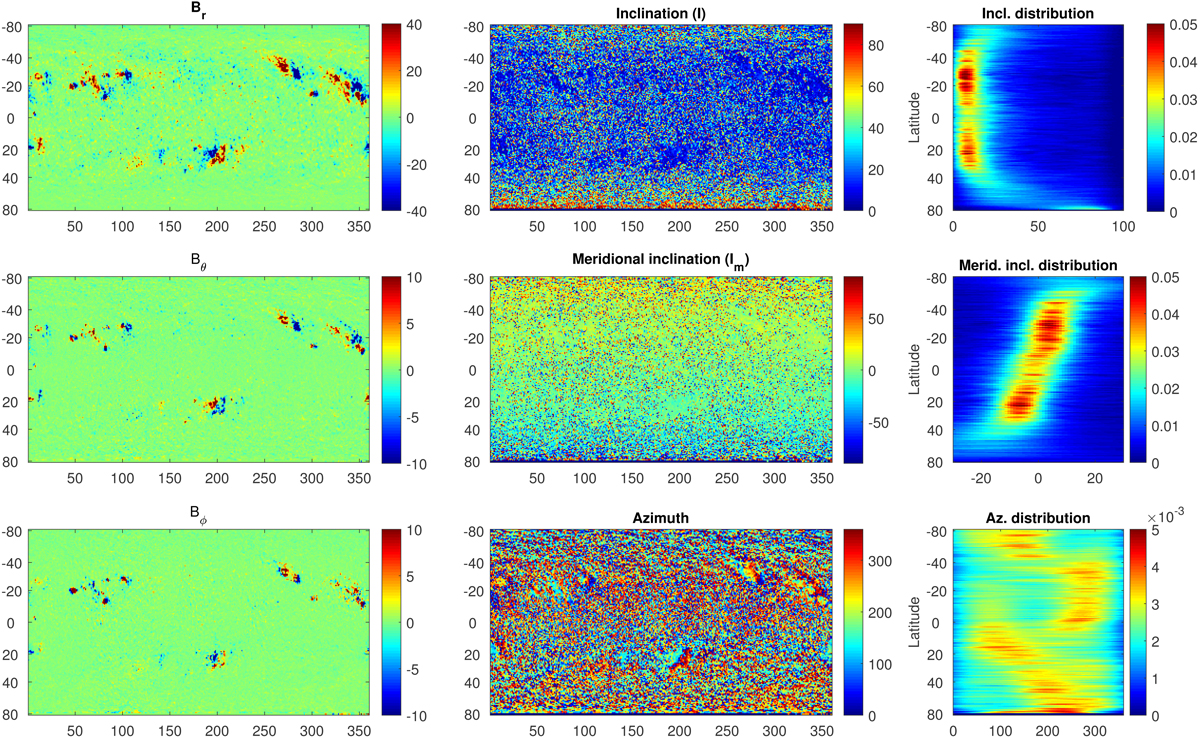
Left: synoptic maps of the three components of the vector magnetic field observed during CR 2100 (August 2010). Middle: corresponding synoptic maps of inclination from radial, meridional inclination, and azimuth. Right: distribution of the values of inclination from radial, meridional inclination, and azimuth for each latitude bin during CR 2100. The color-coding in every horizontal row gives the histogram of values in the corresponding latitude bin. All histograms are normalized to one.
Current usage metrics show cumulative count of Article Views (full-text article views including HTML views, PDF and ePub downloads, according to the available data) and Abstracts Views on Vision4Press platform.
Data correspond to usage on the plateform after 2015. The current usage metrics is available 48-96 hours after online publication and is updated daily on week days.
Initial download of the metrics may take a while.