| Issue |
A&A
Volume 624, April 2019
|
|
|---|---|---|
| Article Number | A70 | |
| Number of page(s) | 12 | |
| Section | Atomic, molecular, and nuclear data | |
| DOI | https://doi.org/10.1051/0004-6361/201834827 | |
| Published online | 11 April 2019 | |
Astrophysical detections and databases for the mono deuterated species of acetaldehyde CH2DCOH and CH3COD⋆
1
Institut des Sciences Moléculaires d’Orsay, CNRS, Univ. Paris-Sud, Université Paris-Saclay, 91405 Orsay, France
e-mail: This email address is being protected from spambots. You need JavaScript enabled to view it.
2
Laboratoire de Physique des Lasers, Atomes et Molécules, UMR CNRS 8523, Bât. P5, Université de Lille I, 59655 Villeneuve d’Ascq Cedex, France
3
IRAP, Université de Toulouse, CNRS, CNES, UPS, 9 Av. Colonel Roche, BP 44346, 31028 Toulouse Cedex 4, France
4
Univ. Rennes, Ecole Nationale Superieure de Chimie de Rennes, CNRS, ISCR-UMR6226, 35000 Rennes, France
Received:
11
December
2018
Accepted:
17
February
2019
Abstract
Context. Detection of deuterated species may provide information on the evolving chemistry in the earliest phases of star-forming regions. For molecules with two isomeric forms of the same isotopic variant, gas-phase and solid-state formation pathways can be differentiated using their abundance ratio.
Aims. Spectroscopic databases for astrophysical purposes are built for the two mono deuterated isomeric species CH2DCOH and CH3COD of the complex organic molecule acetaldehyde. These databases can be used to search and detect these two species in astrophysical surveys, retrieving their column density and therefore abundances.
Methods. Submillimeter wave and terahertz transitions were measured for mono deuterated acetaldehyde CH2DCOH which is a non-rigid species displaying internal rotation of its asymmetrical CH2D methyl group. An analysis of a dataset consisting of previously measured microwave data and the newly measured transition was carried out with a model accounting for the large amplitude torsion.
Results. The frequencies of 2556 transitions are reproduced with a unitless standard deviation of 2.3 yielding various spectroscopic constants. Spectroscopic databases for astrophysical purposes were built for CH2DCOH using the results of the present analysis and for CH3COD using the results of a previous spectroscopic investigation. These two species were both searched for and are detected toward a low-mass star-forming region.
Conclusions. We report the first detection of CH2DCOH (93 transitions) and the detection of CH3COD (43 transitions) species in source B of the IRAS 16293−2422 young stellar binary system located in the ρ Ophiuchus cloud region, using the publicly available ALMA Protostellar Interferometric Line Survey.
Key words: astrochemistry / line: identification / ISM: molecules / ISM: abundances
Tables 3, 4, 7, and 8 are only available at the CDS via anonymous ftp to cdsarc.u-strasbg.fr (130.79.128.5) or via http://cdsarc.u-strasbg.fr/viz-bin/qcat?J/A+A/624/A70
© L. H. Coudert et al. 2019
 Open Access article, published by EDP Sciences, under the terms of the Creative Commons Attribution License (http://creativecommons.org/licenses/by/4.0), which permits unrestricted use, distribution, and reproduction in any medium, provided the original work is properly cited.
1. Introduction
Acetaldehyde and its isotopic species have been the subject of many spectroscopic investigations, due to their astrophysical relevance and to the large amplitude nature of the internal rotation of the methyl group. The microwave spectrum of the normal species was first analyzed by Kilb et al. (1957) and has since then been investigated up to the νt = 4 torsional state (Herschbach 1959; Iijima & Tsuchiya 1972; Bauder & Günthard 1976; Kleiner et al. 1990, 1992, 1996; Smirnov et al. 2014), leading to its detection (Gilmore et al. 1976) in the interstellar medium (ISM). The isotopic species with a symmetrical CH3 or CD3 methyl group were also investigated (Kleiner et al. 1999; Coudert & López 2006; Elkeurti et al. 2010; Zaleski et al. 2017), but none are detected in the ISM. There is only a limited number of spectroscopic results for isotopic species with a partially deuterated CH2D or CD2H asymmetrical methyl group. The mono and bideuterated species CH2DCOH and CD2HCOH have been studied (Turner & Cox 1976; Turner et al. 1981), but only a few transitions characterized by a low Ka value were assigned as there was no model available at that time to treat the internal rotation of a partially deuterated methyl group.
Deuterated species are an important tool for understanding interstellar chemistry and specifically surface chemistry (Charnley et al. 1997; Ratajczak et al. 2011). Deuterium forms slightly stronger bonds than hydrogen at low temperatures (< 100 K) and the abundance of deuterium-bearing molecules can become larger than the cosmic D/H ratio of 10−5. A large fractionation ratio has been found in many environments such as dark clouds, low-mass and high-mass protostars, as well as protoplanetary disks (see Ceccarelli et al. 2014, for a review). For complex organic molecules (organic molecules containing at least six atoms, Herbst & van Dishoeck 2009), there usually exist two different isomeric mono deuterated species and their abundance ratio yields additional information about interstellar chemistry. This may allow differentiation of gas-phase and grain surface formation pathways. For example, the observed gas-phase [CH2DOH]/[CH3OD] ratios found in the Orion KL compact ridge as well as the low-mass protostar IRAS 16293−2422, are found to scale inversely with [HDO]/[H2O] owing to the H/D exchange equilibrium between the hydroxyl (-OH) functional groups of methanol and water in the ice (Faure et al. 2015). These observations are useful constraints for kinetics models of the deuterium chemistry occurring in the icy mantles of interstellar grains. This article focuses on the study of the mono deuterated CH2DCOH and CH3COD isotopic variants of acetaldehyde. We present in Sect. 2 the spectroscopic investigation of CH2DCOH and the compilation of its database and that of CH3COD. We first spectroscopically characterized the species that has a partially deuterated CH2D methyl group, prior to designing its database. For the species with a symmetrical CH3 methyl group, the database is based on the previous spectroscopic investigation by Elkeurti et al. (2010). We present in Sect. 3 the astrophysical search and detection of both species.
2. Spectroscopic investigation of CH2DCOH
The main isotopic species of acetaldehyde and its isotopic variants with a symmetrical CH3 or CD3 methyl group were studied accounting for their internal rotation with theoretical approaches initially developed for methanol (Koehler & Dennison 1940; Burkhard & Dennison 1951; Ivash & Dennison 1953; Hecht & Dennison 1957a,b; Lees & Baker 1968; De Lucia et al. 1989). In the case of the present isotopic species, displaying internal rotation of an asymmetrical partially deuterated CH2D methyl group, several theoretical models are also available and were applied to mono and bideuterated methyl formate and methanol (Margulès et al. 2009; Coudert et al. 2012, 2014; Pearson et al. 2012; Ndao et al. 2015).
In this section, the tunneling-rotation energy levels of CH2DCOH are calculated using the approach developed for mono deuterated methyl formate (Margulès et al. 2009), based on the high-barrier internal axis method (IAM) approach of Hougen (1985) and Coudert & Hougen (1988). This IAM treatment is used to analyze the previously available microwave transitions (Turner & Cox 1976; Turner et al. 1981) and the submillimeter wave and terahertz transitions measured in this work.
2.1. Experimental
The transitions measured in this work were recorded in the 150–990 GHz frequency range using the Lille spectrometer (Zakharenko et al. 2015). The absorption cell was a stainless-steel tube (6 cm diameter, 220 cm long). The sample during measurements was at a pressure of about 10 Pa and at room temperature; the linewidth was limited by Doppler broadening. The frequency ranges 150–330, 400–660, and 780–990 GHz were covered with various active and passive frequency multipliers from VDI Inc. and an Agilent synthesizer (12.5–18.25 GHz) was used as the source of radiation. Estimated uncertainties for measured line frequencies are either 30 or 50 kHz depending on the observed signal-to-noise ratio (S/N) and the frequency range. Figure 1 shows two portions of the spectrum recorded in the submillimeter wave region.
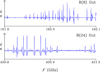 |
Fig. 1. Two portions of the spectrum recorded in the submillimeter wave region are plotted as a function of the frequency F in GHz. For the Out conformation, the upper and lower panels show tunneling components of the R(8) and R(24) transitions, respectively. The K-type structure can be clearly seen in both cases. |
2.2. Theory
The model developed previously for mono deuterated methyl formate (Margulès et al. 2009) can be applied to mono deuterated acetaldehyde CH2DCOH with almost no changes. The coordinates used in this model are the usual Euler angles χ, θ, ϕ and a large amplitude angular coordinate, denoted α, parameterizing the internal rotation of the methyl group with respect to the aldehyde group. Molecule-fixed coordinates of the atoms are obtained starting from the scheme introduced for the principal axis method in Sect. 3 of Hougen et al. (1994). The initial configuration drawn in their Fig. 1 defines atom positions in an x′y′z′ axis system such that the axis of internal rotation coincides with the z′ axis. The methyl group atoms are numbered from 1 to 3, with atom 1 being the deuterium atom and atoms 2 and 3, the two hydrogen atoms. The large amplitude coordinate α is the dihedral angle ∠DCCO. Using Sect. 3.1 and Eqs. (1) and (2) of Margulès et al. (2009) allows us to retrieve atom positions in an xyz molecule-fixed axis system which, for any value of α, is the principal axis system in the Ir representation (Bunker 1979).
In agreement with the IAM approach of Hougen (1985) and Coudert & Hougen (1988), the non-superimposable equilibrium configurations of the molecule are chosen. There arise three energetically inequivalent configurations, shown in Fig. 2, identified by their configuration number n, with n = 1, 2, and 3, and characterized by  the value of the torsional angle α around which the reference function is centered. Configurations 1 and 2 are the two C1 symmetry Out configurations with the deuterium atom outside the x′z′ plane. They are higher in energy than Configuration 3, the Cs symmetry In configuration with the deuterium atom in the symmetry plane. The energy difference Ed between the zero point energy of the two Out configurations and that of the In configuration was estimated by Turner et al. (1981) to be 15.55 cm−1.
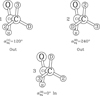 |
Fig. 2. Both energetically equivalent configurations of the Out conformation and the lower energy configuration of the In conformation are identified by their configuration number n = 1, 2, and 3. |


Equations (12) and (13) of Margulès et al. (2009) should be used to obtain the tunneling matrix elements HJKγ1; JK′γ′2 of the 1 → 2 tunneling path connecting the isoenergetic Configurations 1 and 2. Similarly, Eqs. (14) and (15) should be used for tunneling matrix elements HJKγ1; JK′γ′3 of the 1 → 3 tunneling path connecting Configurations 1 and 3. In Eqs. (12)–(15) of Margulès et al. (2009), h2 and h3 are the magnitude of the tunneling splittings and θ2, ϕ2 and χ3, θ3, ϕ3 are 5 Eulerian-type angles describing the rotational dependence of the tunneling matrix elements. In addition to these parameters, computing the rotation-torsion energy also requires the rotational constants of the In and Out conformations, AIn, BIn, CIn and AOut, BOut, COut, respectively, and their energy difference Ed.
When tunneling effects are small, the In conformation displays asymmetric-top rotational energies. For the + and − sublevels arising from the Out conformation, Eq. (21) of Margulès et al. (2009) shows that Ed ± h2 should be added to the asymmetric-top rotational energies, where the upper (lower) sign is for the + (−) sublevel. As h2 is negative (Hougen 1985; Coudert & Hougen 1988), the + sublevel is below the − sublevel. Parallel a-type and perpendicular b-type transitions arise within the In and Out conformations. For the latter conformation, the selection rule ± ↔ ± holds. Perpendicular c-type transitions arise within the Out conformation only and obey the selection rule ± ↔ ∓.
When tunneling effects are large, distortion terms to the tunneling matrix elements HJKγ1; JK′γ′2 and HJKγ1; JK′γ′3 should be added and those defined in Eq. (22) of Margulès et al. (2009) are used. Distortion effects to the five Eulerian-type angles are also accounted for using a polynomial-type expansion in J(J + 1).
Assigning the levels arising from numerical diagonalization of the Hamiltonian matrix in terms of rotational quantum numbers Ka and Kc and of + and − tunneling labels is not straightforward as the ordering of the tunneling sublevels changes for large enough Ka-values. The level assignment chosen here is consistent with symmetry and ensures a smooth variation of the tunneling splitting as a function of Ka for each J-value. For a given Ka-value, the tunneling matrix element HJKγ1; JK′γ′2 couples the two members of an asymmetry doublet. A mixing of the JKa, Kc, ± and JKa, Kc ± 1, ∓ rotational-tunneling sublevels arises and leads to forbidden transitions with even ΔKa and ΔKc (Turner et al. 1981). Such transitions were assigned in the previous investigations (Turner & Cox 1976; Turner et al. 1981) and in the present work.
The Eulerian-type angles θ2, ϕ2 and χ3, θ3, ϕ3 were calculated numerically solving Eqs. (49) of Hougen (1985) for each tunneling motion and computing α-dependent atom positions with the structure of Kilb et al. (1957). Table 1 lists the computed values along with calculated rotational constants and dipole moment components. The latter were obtained from Turner & Cox (1978) using their favored orientation.
Calculated molecular parameters.
2.3. Line assignment and line frequency analysis
Starting from the results of Turner & Cox (1976), parallel a-type and perpendicular b-type transitions within the In conformation were assigned up to J = 36 and Ka = 3. This first set of transitions was fitted with a Watson-type Hamiltonian. Parallel a-type and perpendicular b- and c-type transitions within and between the + and − sublevels of the Out conformation were afterwards assigned up to J = 36 and Ka = 4, using the results of Turner et al. (1981). Fitting of this second set of transitions yielded rotational constants for the Out conformation, the magnitude of the tunneling splitting h2, and the Eulerian-type angles θ2 and ϕ2. Both sets of transitions were then fitted together and the parameters corresponding to the 1 → 3 tunneling motion and the energy difference Ed could be obtained. Transitions perturbed by the coupling between the In and Out conformations (Cox et al. 2003) could then be included in the fit. New transitions were predicted and searched for. For the In conformation, it was possible to assign a-type transitions up to J = 36 and Ka = 14 and b-type transitions up to J = 39 and Ka = 13. For the Out conformation, a-type transitions were assigned up to J = 35 and Ka = 14 and perpendicular b- and c-type transition up to J = 36 and Ka = 5. The smaller number of perpendicular transitions assigned for the Out conformation than for the In conformation may be due to two factors. The first possible explanation is decreased strength, due to a smaller value of the x dipole moment component of this conformation compared to that of the In conformation, as emphasized by Table 1. Alternatively, there may be a less favorable Boltzmann factor due to a larger A rotational constant for the Out conformation than for the In conformation and the fact that the Out conformation is 15 cm−1 above the In conformation. Table 2 lists the number of assigned transitions for each conformation counting forbidden even ΔKa and ΔKc transitions of the Out conformation as a-type transitions.
Assigned transitions.
In the final analysis, experimental frequencies were introduced in a least-squares fit procedure where they were given a weight equal to the inverse of their experimental uncertainty squared. Unresolved K-type doublets were treated as in Margulès et al. (2009). The rotational Watson-type Hamiltonians used for the In and Out conformations were written using Watson’s A-set of distortion parameters (Watson 1967, 1968a,b). The root mean square value of the observed minus calculated frequency is 0.054 MHz for transitions within the In conformation, 0.193 MHz for transitions within the Out conformation, and 0.151 MHz for all transitions. The unitless standard deviation of this final analysis is 2.3 For the whole dataset, assignments, observed and calculated frequencies, and residuals are listed in Table 3 available at the CDS. This table displays 13 columns. Columns 1–4 (5–8) give the assignment of the upper (lower) level in terms of J, Ka, Kc rotational quantum numbers and a vibrational label v. The latter is zero for the In conformation and + or − for the two tunneling sublevels of the Out conformation (see Sect. 2.2). Column 9 is the observed frequency in MHz; Col. 10 its uncertainty in kHz; Col. 11 is the observed minus calculated residual in kHz; Col. 12 is blank for a single line and d for a line belonging to an unresolved K-type doublet; and Col. 13 gives the reference from which the transition was taken. Table 4, also available at the CDS, lists the parameters determined in the analysis. This table displays 3 columns. Column 1 gives the parameter name; Col. 2 its value; and Col. 3 its uncertainty. Table 5 only lists the lowest order parameters. For the rotational constants, the calculated values in Table 1 are within 0.01 cm−1 from the experimental values in Table 5. For the Eulerian-type angles describing the rotational dependence of the tunneling matrix elements, the discrepancies are at most 5%.
Spectroscopic parameters
2.4. Spectroscopic database for CH2DCOH and CH3COD
For CH2DCOH, the spectroscopic database was built using the results of the previous sections. Transitions were calculated up to J = 26 and their line strength and line intensity were computed using the dipole moment components in Table 1. For CH3COD, the results of the analysis carried out by Elkeurti et al. (2010) were used and transitions were calculated using the same maximum value of J. Partition functions Qrot, listed in Table 6, were computed for several temperatures taking a degeneracy factors equal to (2J + 1). A zero energy was taken for the In conformation 000 level of CH2DCOH and for the νt = 0 A1 symmetry 000 level of CH3COD. For both species, lines were selected using the procedure in the JPL database catalog line files (Pickett et al. 1998). An intensity cutoff that depended on the line frequency was taken. Its value in nm2 ⋅ MHz units at 300 K is
 (1)
(1)
Partition function Qrot of CH2DCOH and CH3COD.
where F is the frequency in MHz, and LOGSTR0 and LOGSTR1 are two dimensionless constants both set to −8. The linelists, given in Table 7 for CH2DCOH and in Table 8 for CH3COD, are available at the CDS. They are formatted in the same way as the catalog line files of the JPL database (Pickett et al. 1998) and display 16 columns. Columns 1–3 contain respectively the line frequency (FREQ) in MHz, the error (ERR) in MHz, and the base 10 logarithm of the line intensity (LGINT) in nm2 ⋅ MHz units at 300 K. Columns 4–6 give the degrees of freedom of the rotational partition function (DR), the lower state energy (ELO) in cm−1, and the upper state degeneracy (GUP), respectively. Columns 7 and 8 contain the species tag (TAG) and format number (QNFMT), respectively. Finally, cols. 9–12 (13–16) give the assignment of the upper (lower) level in terms of J, Ka, Kc, and a vibrational quantum number. For CH2DCOH, this quantum number is zero for the levels of the In conformation and 1 or 2 for the + and − sublevels of the Out conformation. For CH3COD, this label is 0 for A-symmetry levels and 1 and 2 for E-symmetry levels when νt = 0. This label is 3 and 4 for E-symmetry levels and 5 for A-symmetry levels when νt = 1. For both species, a minimum value of 10 kHz was selected for the calculated error (ERR). For observed unblended microwave lines, the line frequency (FREQ) and the error (ERR) were replaced by their experimental values. This is then indicated by a negative species tag.
3. Astrophysical observations
High deuterium fractionation has been observed in various types of environments such as prestellar cores, hot cores, and hot corinos. Its study is considered to be an efficient probe for studying the physical and chemical conditions of these environments and help us to understand their formation. This is especially interesting for the so-called complex organic molecules such as methanol and bigger molecules for which it may allow differentiation of gas-phase and solid-state formation pathways.
We first used the ASAI (Astrochemical Surveys At Iram)1 IRAM-30 m Large Program data to search for CH2DCOH and CH3COD. The goal of these observations was to carry out unbiased millimeter line surveys between 80 and 272 GHz of a sample of ten template sources, which fully cover the first stages of the formation process of solar-type stars, from prestellar cores to the late protostellar phase (Lefloch et al. 2018). We used the CASSIS2 software for the line identification in the publicly available ASAI data3. We conclude that these species are not detected in all ASAI sources with the single-dish observations, either because they are only present in the dense and hot regions as the hot corinos, or present with a too small abundance in the colder extended envelope to be detected by these observations.
We then used ALMA interferometric observations toward the very line rich source IRAS 16293−2422 (hereafter IRAS16293). IRAS16293 is a deeply embedded young stellar binary system located in the L1689 region in the ρ Ophiuchus cloud region, extensively studied through millimeter and submillimeter single-dish and interferometer observations. It has a cold outer envelope (with spatial scales of up to ∼6000 au) (Jaber Al-Edhari et al. 2017) and a hot corino at scales of ∼100 au (Jørgensen et al. 2016). Due to its hot-core-like properties, a wealth of complex organic have been reported toward its two binary components: I16293A and I16293B, separated by 5″ (Wootten 1989). We used the publicly available ALMA Protostellar Interferometric Line Survey (PILS, Jørgensen et al. 2016), an unbiased spectral survey of IRAS16293 covering a frequency range of about [329–363] GHz of ALMA’s Band 7, performed in ALMA’s Cycle 2 (project-id: 2013.1.00278.S). Full observational details are given in Jørgensen et al. 2016. The entire raw dataset of this survey is accessible on the ALMA website. In this work, we only used the data obtained with the 12 m dishes array (∼38 antennas in the array at the time of observations), that we reprocessed using the standard pipeline scripts to obtain data-cubes with the ultimate spectral resolution of δv ∼ 0.25 km s−1, in a 0.5″ beam located ∼1″ east of source B (αJ2000 = 16 h 32 m 22.5375 s; δJ2000 = −24 ° 28′ 32.555″), necessary to decrease the damaging effect of line blending.
We first computed local thermodynamic equilibrium (LTE) synthetic spectra, using the CASSIS software, of the expected brightest lines of CH2DCOH and CH3COD species in the PILS frequency range, limiting the search for transitions with Ai, j ≥ 0.001 s−1 and Eup ≤ 500 K. For the synthetic spectra we assumed a source size larger than the beam (3″), an excitation temperature of 100 K, a line width of 0.8 km s−1, and a column density of 5 × 1014 cm−2 for CH2DCOH and 3.5 × 1014 cm−2 for CH3COD respectively. We limited the search in a 10 GHz spectral band among the 34 GHz of the PILS survey, where the density of CH2DCOH and CH3COD lines was the largest. The goal being the identification of the CH2DCOH and CH3COD lines, we did not optimize neither the data processing, nor the CASSIS LTE modeling to reproduce the line intensities. Figures A.1 and A.2 show the detection of 93 CH2DCOH lines and 43 CH3COD lines in this 10 GHz frequency range (among, respectively, the 101 and 99 present in the frequency range with the thresholds used). Tables A.1 and A.2 show the detected lines parameters. Note that Jørgensen et al. (2018) reported the detection of CH3COD in IRAS 16293-2422B.
It can be noted that with the thresholds used, all CH2DCOH lines are detected, except transition 183, 16, 0–173, 15, 0, which is predicted to be much brighter than observed and transitions 2011, 10, 1–1911, 9, 1, 2011, 9, 1–1911, 8, 1, 2011, 9, 2–1911, 8, 2, and 2011, 10, 2–1911, 9, 2, which have an Eup ≥ 450 K. For CH3COD, all undetected transitions but two have an Eup ≥ 340 K. The non-detection of some lines is therefore only due to the sensitivity limit of the PILS survey.
4. Conclusions
The rotation-torsion spectrum of the non-rigid mono deuterated acetaldehyde CH2DCOH was experimentally and theoretically investigated. Due to the internal rotation of the asymmetrical CH2D methyl group, the ground vibrational state of the molecule is split into three torsional sublevels. Transitions within and between these sublevels were measured in the submillimeter wave and terahertz spectra described in Sect. 2.1. These transitions along with previously measured ones (Turner & Cox 1976; Turner et al. 1981) were fitted using the IAM treatment (Hougen 1985; Coudert & Hougen 1988) presented in Sect. 2.2. The frequency of 2556 transitions could be reproduced with a 2.3 unitless standard deviation. The good agreement between calculated spectroscopic parameters in Table 1 and their experimental values in Table 5 emphasizes a fairly good understanding of the three first torsional levels of mono deuterated acetaldehyde CH2DCOH.
The present analysis allowed us to evidence two types of tunneling motions. In addition to the tunneling motion connecting the two energetically equivalent Out configurations, dealt with in mono deuterated methyl formate (Margulès et al. 2009), it was possible to observe the tunneling motion connecting the energetically inequivalent In and Out conformations. This second tunneling motion leads only to shifts as it connects levels that already have different energies (Cox et al. 2003). Figure 3 illustrates the effects of both tunneling motions. The tunneling motion connecting the two energetically equivalent Out configurations leads to an 800 MHz tunneling splitting clearly visible in this figure. The effects of the tunneling motion connecting the In and Out conformations are smaller and become important when level crossings occur.
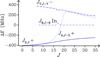 |
Fig. 3. Effects of the two tunneling motions ΔE are plotted in MHz as a function of J for several Ka-values and for all three tunneling sublevels. In identifies the level arising from the In conformation. + and − identify the tunneling sublevels arising from the Out conformation. The effects of the tunneling motion connecting the In and Out conformations can be seen for the 178, 9 In and 177, 10 − sublevels. |
The results of the analysis were used to build a database for astrophysical purposes for CH2DCOH. A similar database, for the isomeric mono deuterated species CH3COD, was compiled starting from the results of the previously published analysis of Elkeurti et al. (2010). With these databases, we have conducted a search of CH2DCOH and CH3COD lines in the publicly available ASAI IRAM-30m Large Program and the ALMA Protostellar Interferometric Line Survey (PILS, Jørgensen et al. 2016). Both CH2DCOH (93 transitions) and CH3COD (43 transitions) species were detected in the IRAS 16293-2422 source B young stellar object alone, located in the ρ Ophiuchus cloud region. Tables A.1 and A.2 list the transitions identified in this source.
References
- Bauder, A., & Günthard, H. H. 1976, J. Mol. Spectr., 60, 290 [NASA ADS] [CrossRef] [Google Scholar]
- Bunker, P. R. 1979, Molecular Symmetry and Spectroscopy, 1st edn. (New York: Academic Press) [Google Scholar]
- Burkhard, D. G., & Dennison, D. M. 1951, Phys. Rev., 84, 408 [NASA ADS] [CrossRef] [Google Scholar]
- Ceccarelli, C., Caselli, P., Bockelée-Morvan, D., et al. 2014, Protostars and Planets VI, 859 [Google Scholar]
- Charnley, S. B., Tielens, A. G. G. M., & Rodgers, S. D. 1997, ApJ, 482, L203 [NASA ADS] [CrossRef] [Google Scholar]
- Coudert, L. H., & Hougen, J. T. 1988, J. Mol. Spectr., 130, 86 [NASA ADS] [CrossRef] [Google Scholar]
- Coudert, L. H., & López, J. C. 2006, J. Mol. Spectr., 239, 135 [NASA ADS] [CrossRef] [Google Scholar]
- Coudert, L. H., Margulès, L., Huet, T. R., et al. 2012, A&A, 543, A46 [NASA ADS] [CrossRef] [EDP Sciences] [Google Scholar]
- Coudert, L. H., Zemouli, M., Motiyenko, R. A., Margulès, L., & Klee, S. 2014, J. Chem. Phys., 140, 064307 [NASA ADS] [CrossRef] [Google Scholar]
- Cox, A. P., Hughes, K. H., & MacDonald, J. N. 2003, Mol. Phys., 101, 569 [NASA ADS] [CrossRef] [Google Scholar]
- De Lucia, F. C., Herbst, E., Anderson, T., & Helminger, P. 1989, J. Mol. Spectr., 134, 395 [NASA ADS] [CrossRef] [Google Scholar]
- Elkeurti, M., Coudert, L. H., Medvedev, I. R., et al. 2010, J. Mol. Spectr., 263, 145 [NASA ADS] [CrossRef] [Google Scholar]
- Faure, A., Faure, M., Theulé, P., Quirico, E., & Schmitt, B. 2015, A&A, 584, A98 [NASA ADS] [CrossRef] [EDP Sciences] [Google Scholar]
- Gilmore, W., Morris, M., Johnson, D. R., et al. 1976, ApJ, 204, 43 [NASA ADS] [CrossRef] [Google Scholar]
- Hecht, K. T., & Dennison, D. M. 1957a, J. Chem. Phys., 26, 31 [NASA ADS] [CrossRef] [Google Scholar]
- Hecht, K. T., & Dennison, D. M. 1957b, J. Chem. Phys., 26, 48 [NASA ADS] [CrossRef] [Google Scholar]
- Herbst, E., & van Dishoeck, E. F. 2009, ARA&A, 47, 427 [NASA ADS] [CrossRef] [Google Scholar]
- Herschbach, D. R. 1959, J. Chem. Phys., 31, 91 [NASA ADS] [CrossRef] [Google Scholar]
- Hougen, J. T. 1985, J. Mol. Spectr., 114, 395 [NASA ADS] [CrossRef] [Google Scholar]
- Hougen, J. T., Kleiner, I., & Godefroid, M. 1994, J. Mol. Spectr., 163, 559 [NASA ADS] [CrossRef] [Google Scholar]
- Iijima, T., & Tsuchiya, S. 1972, J. Mol. Spectr., 44, 88 [NASA ADS] [CrossRef] [Google Scholar]
- Ivash, E. V., & Dennison, D. M. 1953, J. Chem. Phys., 21, 1804 [NASA ADS] [CrossRef] [Google Scholar]
- Jaber Al-Edhari, A., Ceccarelli, C., Kahane, C., Viti, S., et al. 2017, A&A, 597, 40 [Google Scholar]
- Jørgensen, J. K., van der Wiel, M. H. D., Coutens, A., et al. 2016, A&A, 595, A117 [NASA ADS] [CrossRef] [EDP Sciences] [Google Scholar]
- Jørgensen, J. K., Müller, H. S. P., Calcutt, H., et al. 2018, A&A, 620, A170 [NASA ADS] [CrossRef] [EDP Sciences] [Google Scholar]
- Kilb, R. W., Lin, C. C., & Wilson, Jr., E. B. 1957, J. Chem. Phys., 26, 1695 [NASA ADS] [CrossRef] [Google Scholar]
- Kleiner, I., Godefroid, M., Herman, M., & McKellar, A. R. W. 1990, J. Mol. Spectr., 142, 238 [NASA ADS] [CrossRef] [Google Scholar]
- Kleiner, I., Hougen, J. T., Suenram, R. D., Lovas, F. J., & Godefroid, M. 1992, J. Mol. Spectr., 153, 578 [NASA ADS] [CrossRef] [Google Scholar]
- Kleiner, I., Hougen, J. T., Grabow, J.-U., et al. 1996, J. Mol. Spectr., 179, 41 [NASA ADS] [CrossRef] [Google Scholar]
- Kleiner, I., Lopez, J. C., Blanco, S., McKellar, A. R. W., & Moazzen-Ahmadi, N. 1999, J. Mol. Spectr., 197, 275 [NASA ADS] [CrossRef] [Google Scholar]
- Koehler, J. S., & Dennison, D. M. 1940, Phys. Rev., 57, 1006 [NASA ADS] [CrossRef] [Google Scholar]
- Lees, R. M., & Baker, J. G. 1968, J. Chem. Phys., 48, 5299 [NASA ADS] [CrossRef] [Google Scholar]
- Lefloch, B., Bachiller, R., Ceccarelli, C., et al. 2018, MNRAS, 477, 4792 [NASA ADS] [CrossRef] [Google Scholar]
- Margulès, L., Coudert, L. H., Møllendal, H., et al. 2009, J. Mol. Spectr., 254, 55 [NASA ADS] [CrossRef] [Google Scholar]
- Ndao, M., Kwabia Tchana, F., Coudert, L. H., et al. 2015, J. Mol. Spectr., 326, 136 [NASA ADS] [CrossRef] [Google Scholar]
- Pearson, J. C., Yu, S., & Drouin, B. J. 2012, J. Mol. Spectr., 280, 119 [NASA ADS] [CrossRef] [Google Scholar]
- Pickett, H. M., Poynter, R. L., Cohen, E. A., et al. 1998, J. Quant. Spectr. Radiat. Transfer, 60, 883 [Google Scholar]
- Ratajczak, A., Taquet, V., Kahane, C., et al. 2011, A&A, 528, L13 [NASA ADS] [CrossRef] [EDP Sciences] [Google Scholar]
- Smirnov, I. A., Alekseev, E. A., Ilyushin, V. V., et al. 2014, J. Mol. Spectr., 295, 44 [NASA ADS] [CrossRef] [Google Scholar]
- Turner, P. H., & Cox, A. P. 1976, Chem. Phys. Lett., 42, 84 [NASA ADS] [CrossRef] [Google Scholar]
- Turner, P. H., & Cox, A. P. 1978, J. Chem. Soc. Faraday Trans., 2, 533 [CrossRef] [Google Scholar]
- Turner, P. H., Cox, A. P., & Hardy, J. A. 1981, J. Chem. Soc. Faraday Trans., 2, 1217 [CrossRef] [Google Scholar]
- Watson, J. K. G. 1967, J. Chem. Phys., 46, 1935 [NASA ADS] [CrossRef] [Google Scholar]
- Watson, J. K. G. 1968a, J. Chem. Phys., 48, 181 [NASA ADS] [CrossRef] [Google Scholar]
- Watson, J. K. G. 1968b, J. Chem. Phys., 48, 4517 [NASA ADS] [CrossRef] [Google Scholar]
- Wootten, A. 1989, ApJ, 337, 858 [NASA ADS] [CrossRef] [Google Scholar]
- Zakharenko, O., Motiyenko, R. A., Margulès, L., & Huet, T. R. 2015, J. Mol. Spectr., 317, 41 [Google Scholar]
- Zaleski, D. P., Duan, C., Carvajal, M., Kleiner, I., & Prozument, K. 2017, J. Mol. Spectr., 342, 17 [NASA ADS] [CrossRef] [Google Scholar]
Appendix A: Additional material
 |
Fig. A.1. CH2DCOH observed (in black) and modeled (in red) lines. The lines have been shifted at a VLSR of 2.7 km s−1. The quantum numbers are indicated with a sorting in frequency, for Ai, j ≥ 0.001 s−1 and Eup ≤ 500 K. In the case of multiple transitions, the quantum numbers are indicated from the left to the right, with increasing VLSR. CH2DCOH (183, 16, 0 − 173, 15, 0) is not detected, or predicted to be too bright, and the nearby line is HCOOCH3. |
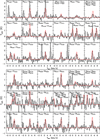 |
Fig. A.2. CH3COD observed (in black) and modeled (in red) lines. The lines have been shifted at a VLSR of 2.7 km s−1. The quantum numbers are indicated with a sorting in frequency, for Ai, j ≥ 0.001 s−1 and Eup ≤ 500 K. In the case of multiple transitions, the quantum numbers are indicated from the left to the right, with increasing VLSR. |
CH2DCOH transitions in the frequency range considered and their main parameters.
CH3COD transitions in the frequency range considered and their main parameters.
All Tables
CH2DCOH transitions in the frequency range considered and their main parameters.
CH3COD transitions in the frequency range considered and their main parameters.
All Figures
|
Fig. 1. Two portions of the spectrum recorded in the submillimeter wave region are plotted as a function of the frequency F in GHz. For the Out conformation, the upper and lower panels show tunneling components of the R(8) and R(24) transitions, respectively. The K-type structure can be clearly seen in both cases. |
| In the text | |
|
Fig. 2. Both energetically equivalent configurations of the Out conformation and the lower energy configuration of the In conformation are identified by their configuration number n = 1, 2, and 3. |
| In the text | |
|
Fig. 3. Effects of the two tunneling motions ΔE are plotted in MHz as a function of J for several Ka-values and for all three tunneling sublevels. In identifies the level arising from the In conformation. + and − identify the tunneling sublevels arising from the Out conformation. The effects of the tunneling motion connecting the In and Out conformations can be seen for the 178, 9 In and 177, 10 − sublevels. |
| In the text | |
|
Fig. A.1. CH2DCOH observed (in black) and modeled (in red) lines. The lines have been shifted at a VLSR of 2.7 km s−1. The quantum numbers are indicated with a sorting in frequency, for Ai, j ≥ 0.001 s−1 and Eup ≤ 500 K. In the case of multiple transitions, the quantum numbers are indicated from the left to the right, with increasing VLSR. CH2DCOH (183, 16, 0 − 173, 15, 0) is not detected, or predicted to be too bright, and the nearby line is HCOOCH3. |
| In the text | |
|
Fig. A.2. CH3COD observed (in black) and modeled (in red) lines. The lines have been shifted at a VLSR of 2.7 km s−1. The quantum numbers are indicated with a sorting in frequency, for Ai, j ≥ 0.001 s−1 and Eup ≤ 500 K. In the case of multiple transitions, the quantum numbers are indicated from the left to the right, with increasing VLSR. |
| In the text | |
Current usage metrics show cumulative count of Article Views (full-text article views including HTML views, PDF and ePub downloads, according to the available data) and Abstracts Views on Vision4Press platform.
Data correspond to usage on the plateform after 2015. The current usage metrics is available 48-96 hours after online publication and is updated daily on week days.
Initial download of the metrics may take a while.