Open Access
Fig. 1.
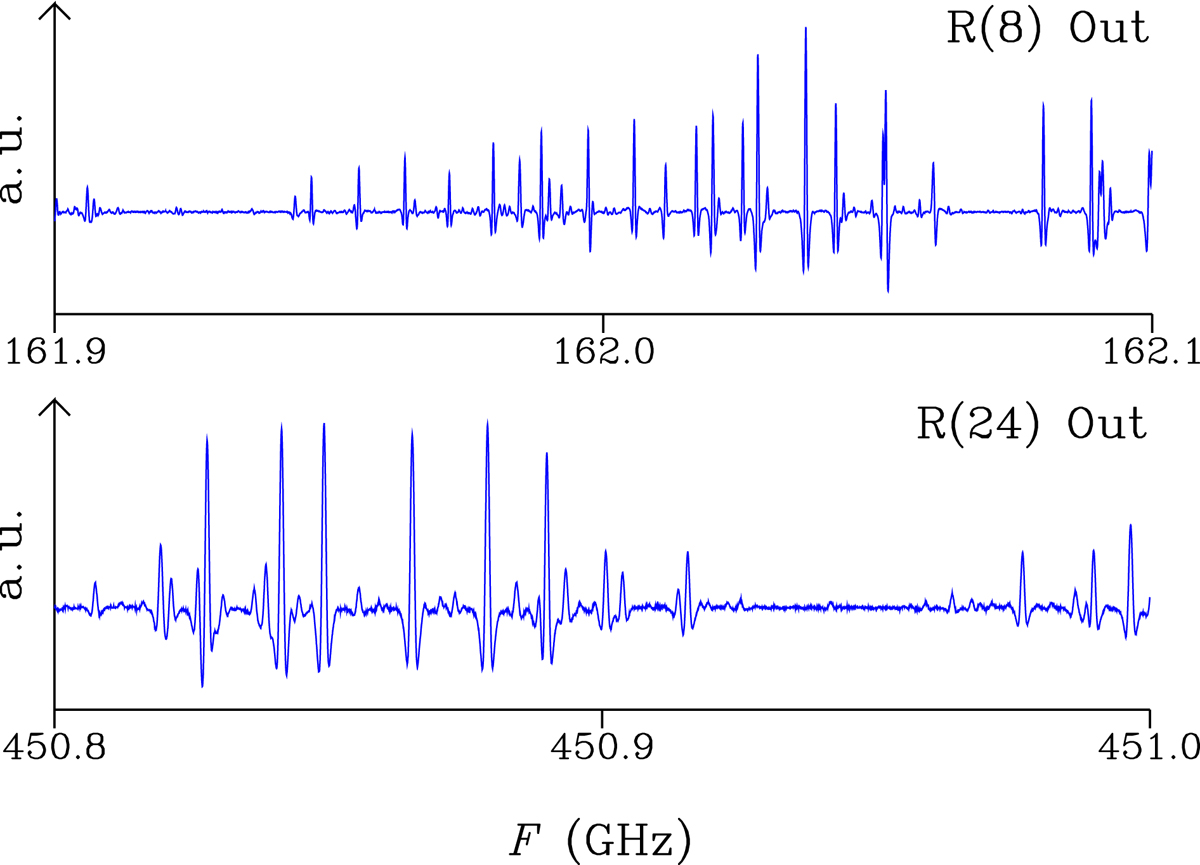
Two portions of the spectrum recorded in the submillimeter wave region are plotted as a function of the frequency F in GHz. For the Out conformation, the upper and lower panels show tunneling components of the R(8) and R(24) transitions, respectively. The K-type structure can be clearly seen in both cases.
Current usage metrics show cumulative count of Article Views (full-text article views including HTML views, PDF and ePub downloads, according to the available data) and Abstracts Views on Vision4Press platform.
Data correspond to usage on the plateform after 2015. The current usage metrics is available 48-96 hours after online publication and is updated daily on week days.
Initial download of the metrics may take a while.