Fig. 9.
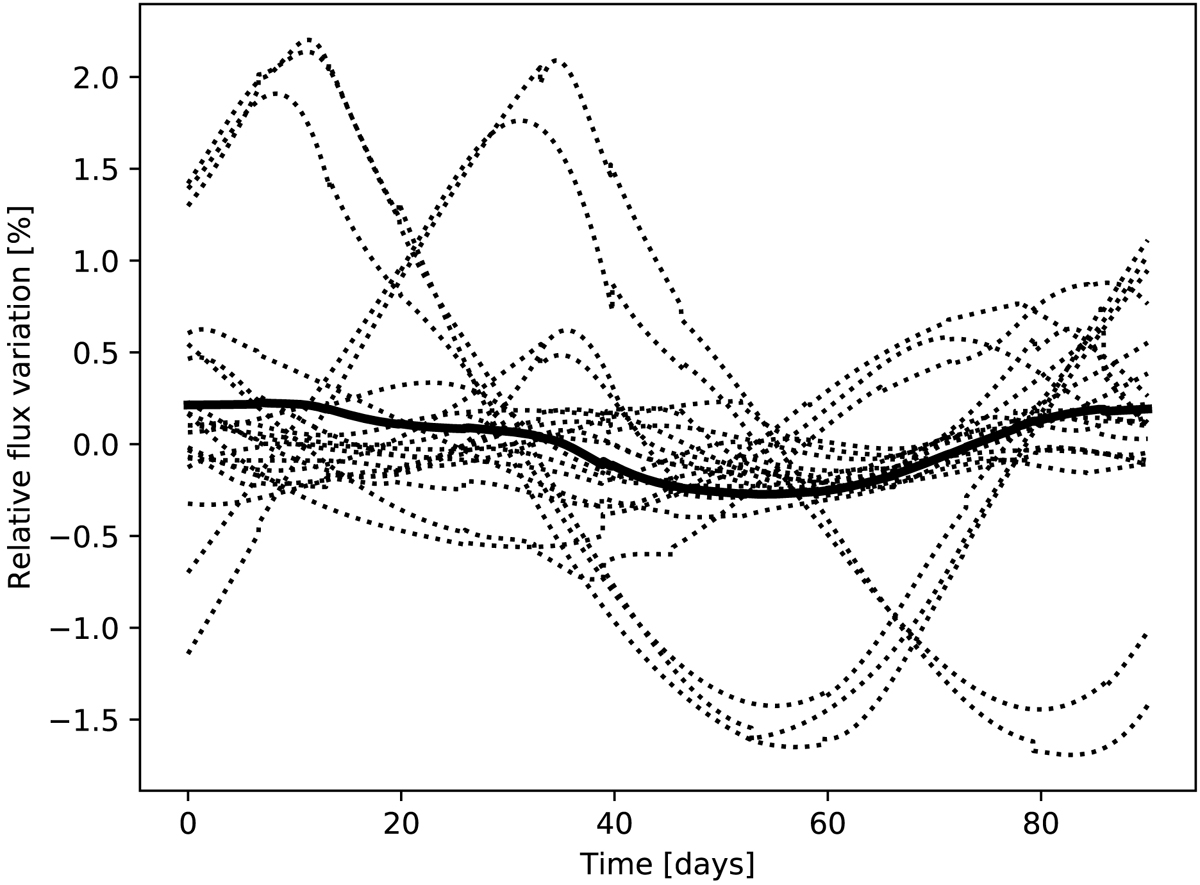
Simulated instrument residual light-curves (systematic errors) over 90 days for a star of mangitude V = 11 and for the EOL conditions. The light-curves are plotted in terms of relative variations and were generated using Eq. (35) and as explained in Sect. (4.10). Each dotted line corresponds to an individual light-curve (here 24 in total) while the thick solid line corresponds to the light-curve obtained by averaging the 24 simulated light-curves.
Current usage metrics show cumulative count of Article Views (full-text article views including HTML views, PDF and ePub downloads, according to the available data) and Abstracts Views on Vision4Press platform.
Data correspond to usage on the plateform after 2015. The current usage metrics is available 48-96 hours after online publication and is updated daily on week days.
Initial download of the metrics may take a while.