Fig. 6.
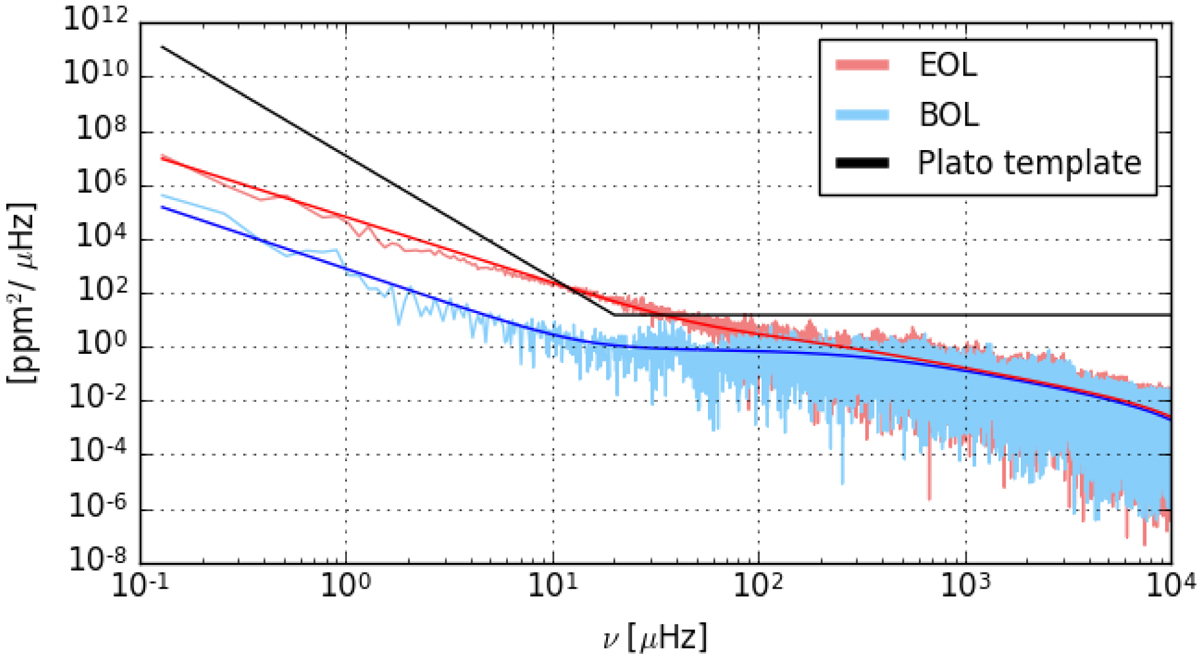
PSD of the residual light-curve obtained with two three-month PIS simulations, one representative of the BOL (cyan) and the second of the EOL (pink). The results shown here correspond to a star of magnitude 11. The solid coloured line represents the fitted model defined in Eq. (33). The solid black line represents the PLATO requirements in terms of systematic errors translated for a single camera by assuming that they are uncorrelated between the different camera (see text).
Current usage metrics show cumulative count of Article Views (full-text article views including HTML views, PDF and ePub downloads, according to the available data) and Abstracts Views on Vision4Press platform.
Data correspond to usage on the plateform after 2015. The current usage metrics is available 48-96 hours after online publication and is updated daily on week days.
Initial download of the metrics may take a while.