Fig. 2.
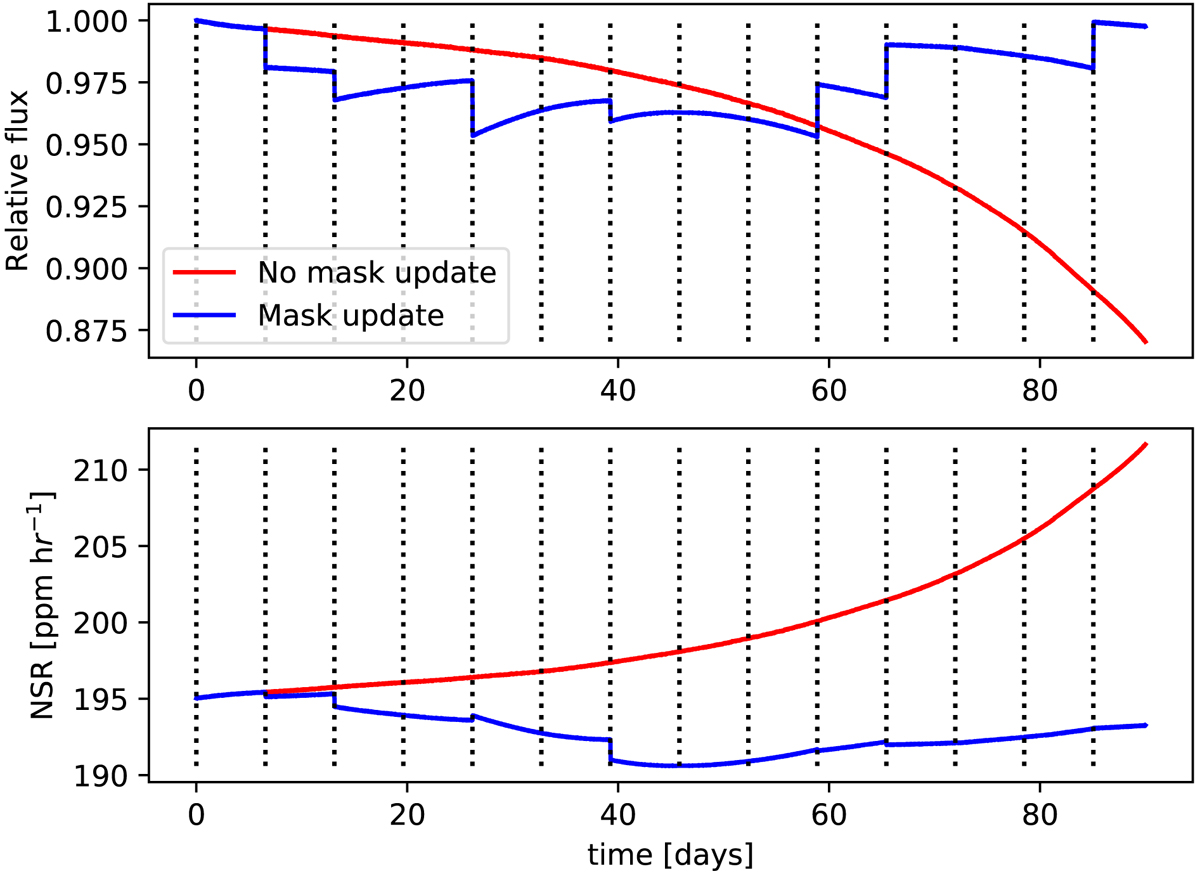
Top: examples of light-curves generated from a simulated time-series of CCD imagettes. The red curve corresponds to the light-curve generated with a fixed binary mask while the blue one includes a series of mask updates. The dotted vertical lines identify the times at which the masks were updated. Bottom: corresponding time variations of the NSR.
Current usage metrics show cumulative count of Article Views (full-text article views including HTML views, PDF and ePub downloads, according to the available data) and Abstracts Views on Vision4Press platform.
Data correspond to usage on the plateform after 2015. The current usage metrics is available 48-96 hours after online publication and is updated daily on week days.
Initial download of the metrics may take a while.