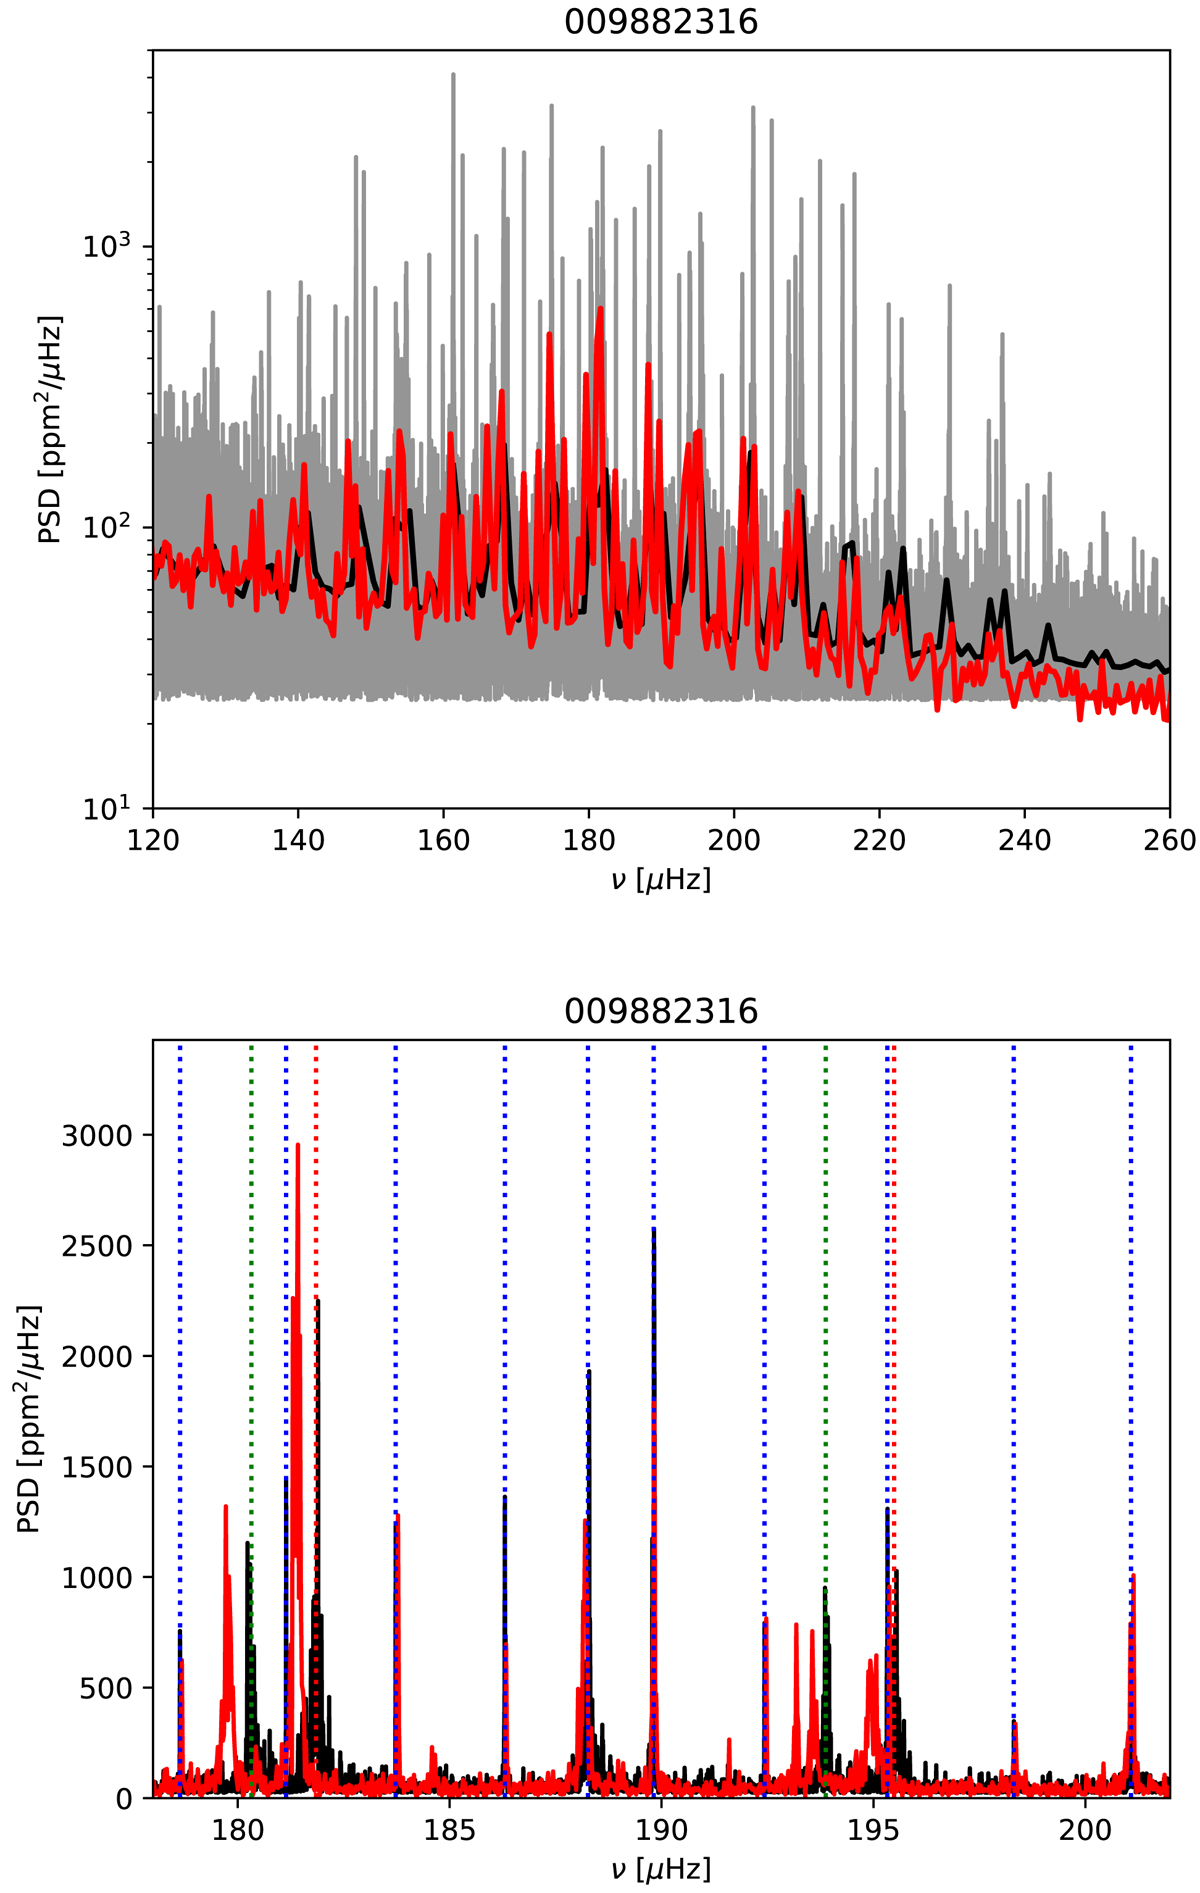
Fig. 16.

Same as Fig. 13 for the red giant star KIC 9882316 observed with Kepler. Top: entire oscillation spectrum. Bottom: zoom around the maximum peak frequency. Here we did not apply a running average over the PSD. The dotted red/blue/green vertical lines represent the frequency locations of the radial/dipole/quadrupole modes respectively.
Current usage metrics show cumulative count of Article Views (full-text article views including HTML views, PDF and ePub downloads, according to the available data) and Abstracts Views on Vision4Press platform.
Data correspond to usage on the plateform after 2015. The current usage metrics is available 48-96 hours after online publication and is updated daily on week days.
Initial download of the metrics may take a while.


