Fig. 12.
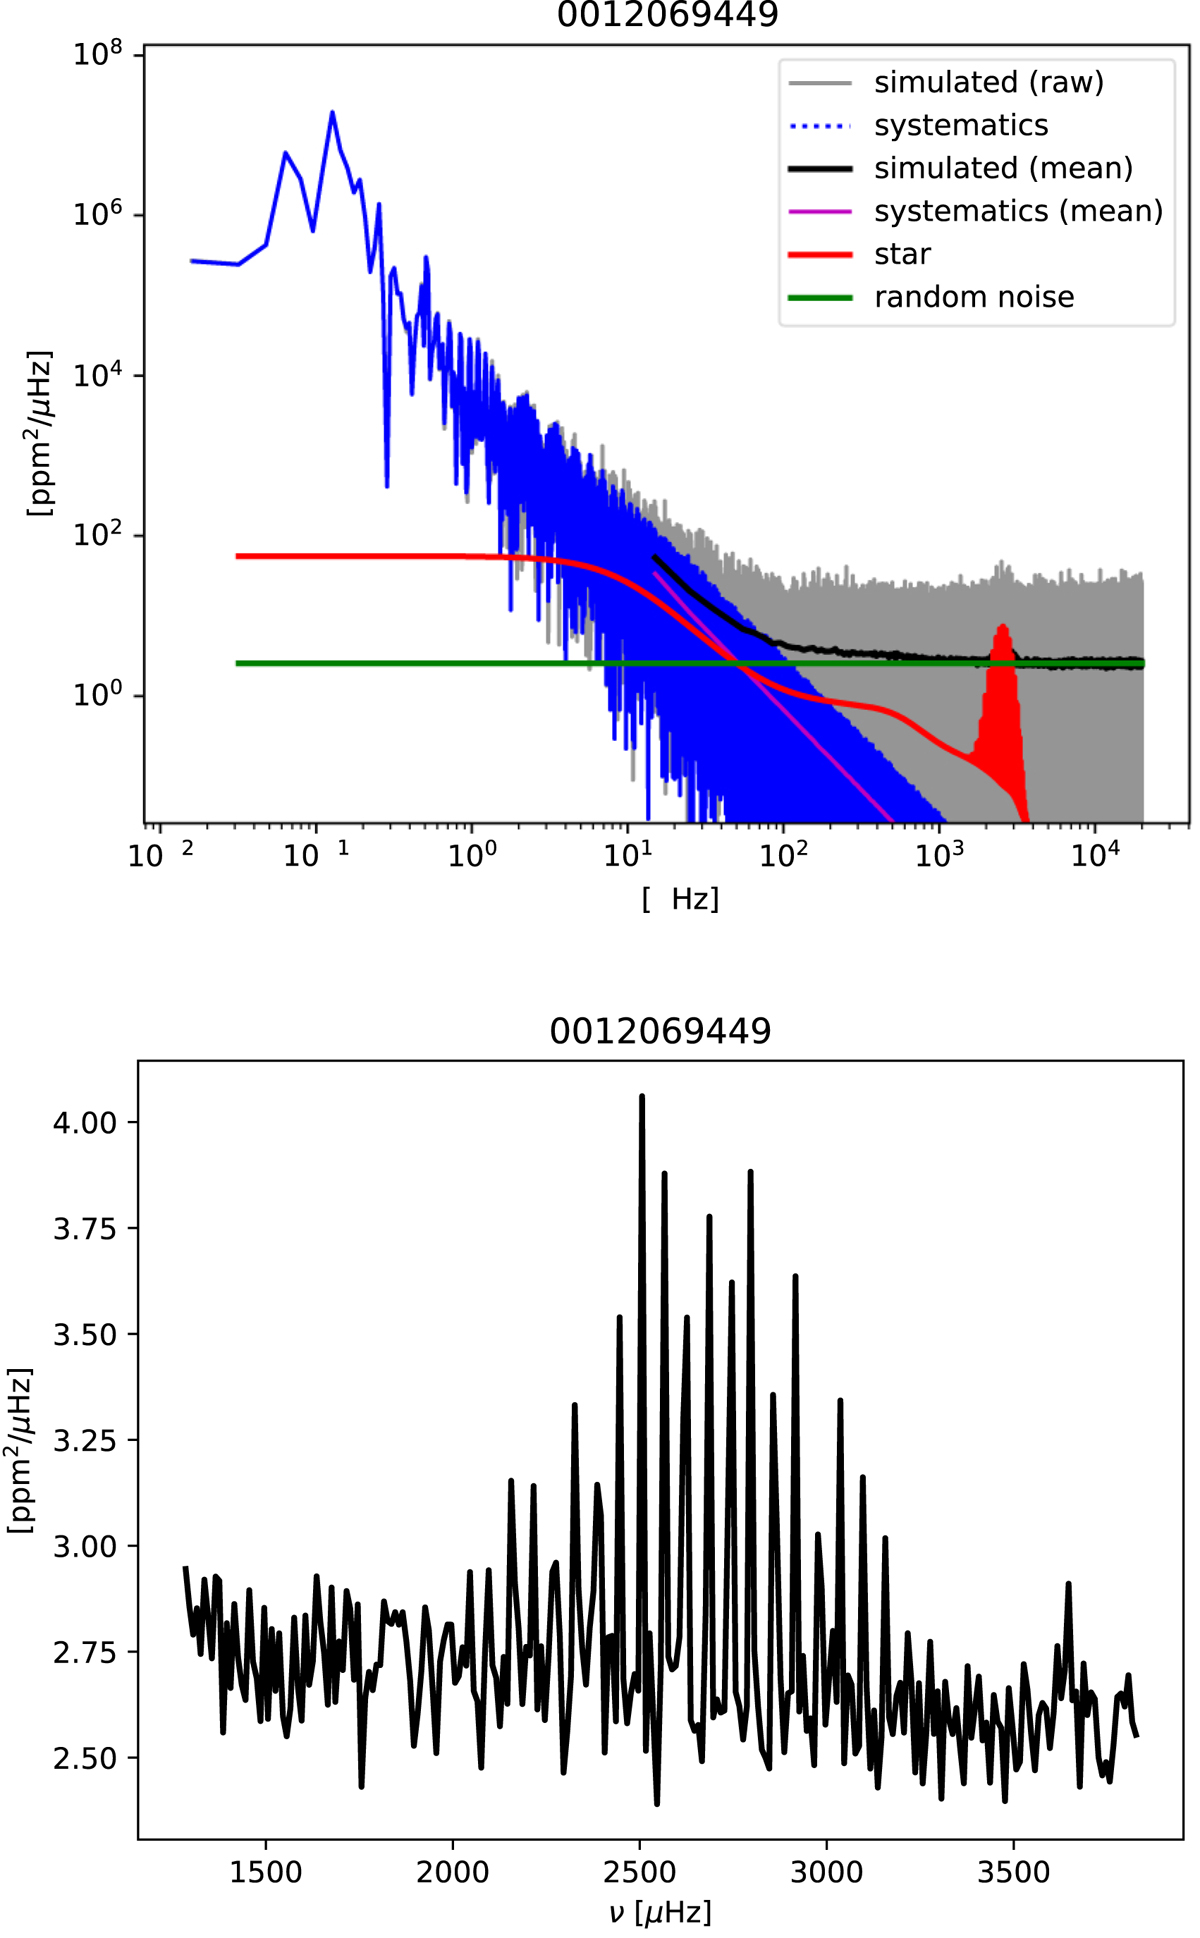
PSD of the simulated light-curve of 16 Cyg B (KIC 12069449) shown in Fig. 11. Top: full PSD. The grey curve represents the raw PSD (i.e. un-smoothed PSD) while the black line corresponds to the PSD obtained after applying a running average over a width of 10 μHz. The coloured lines represent the various contributions to the signal (see the associated legend). Bottom: zoom in the frequency domain where solar-like oscillations are detected. Only the smoothed PSD is shown.
Current usage metrics show cumulative count of Article Views (full-text article views including HTML views, PDF and ePub downloads, according to the available data) and Abstracts Views on Vision4Press platform.
Data correspond to usage on the plateform after 2015. The current usage metrics is available 48-96 hours after online publication and is updated daily on week days.
Initial download of the metrics may take a while.