Fig. 7.
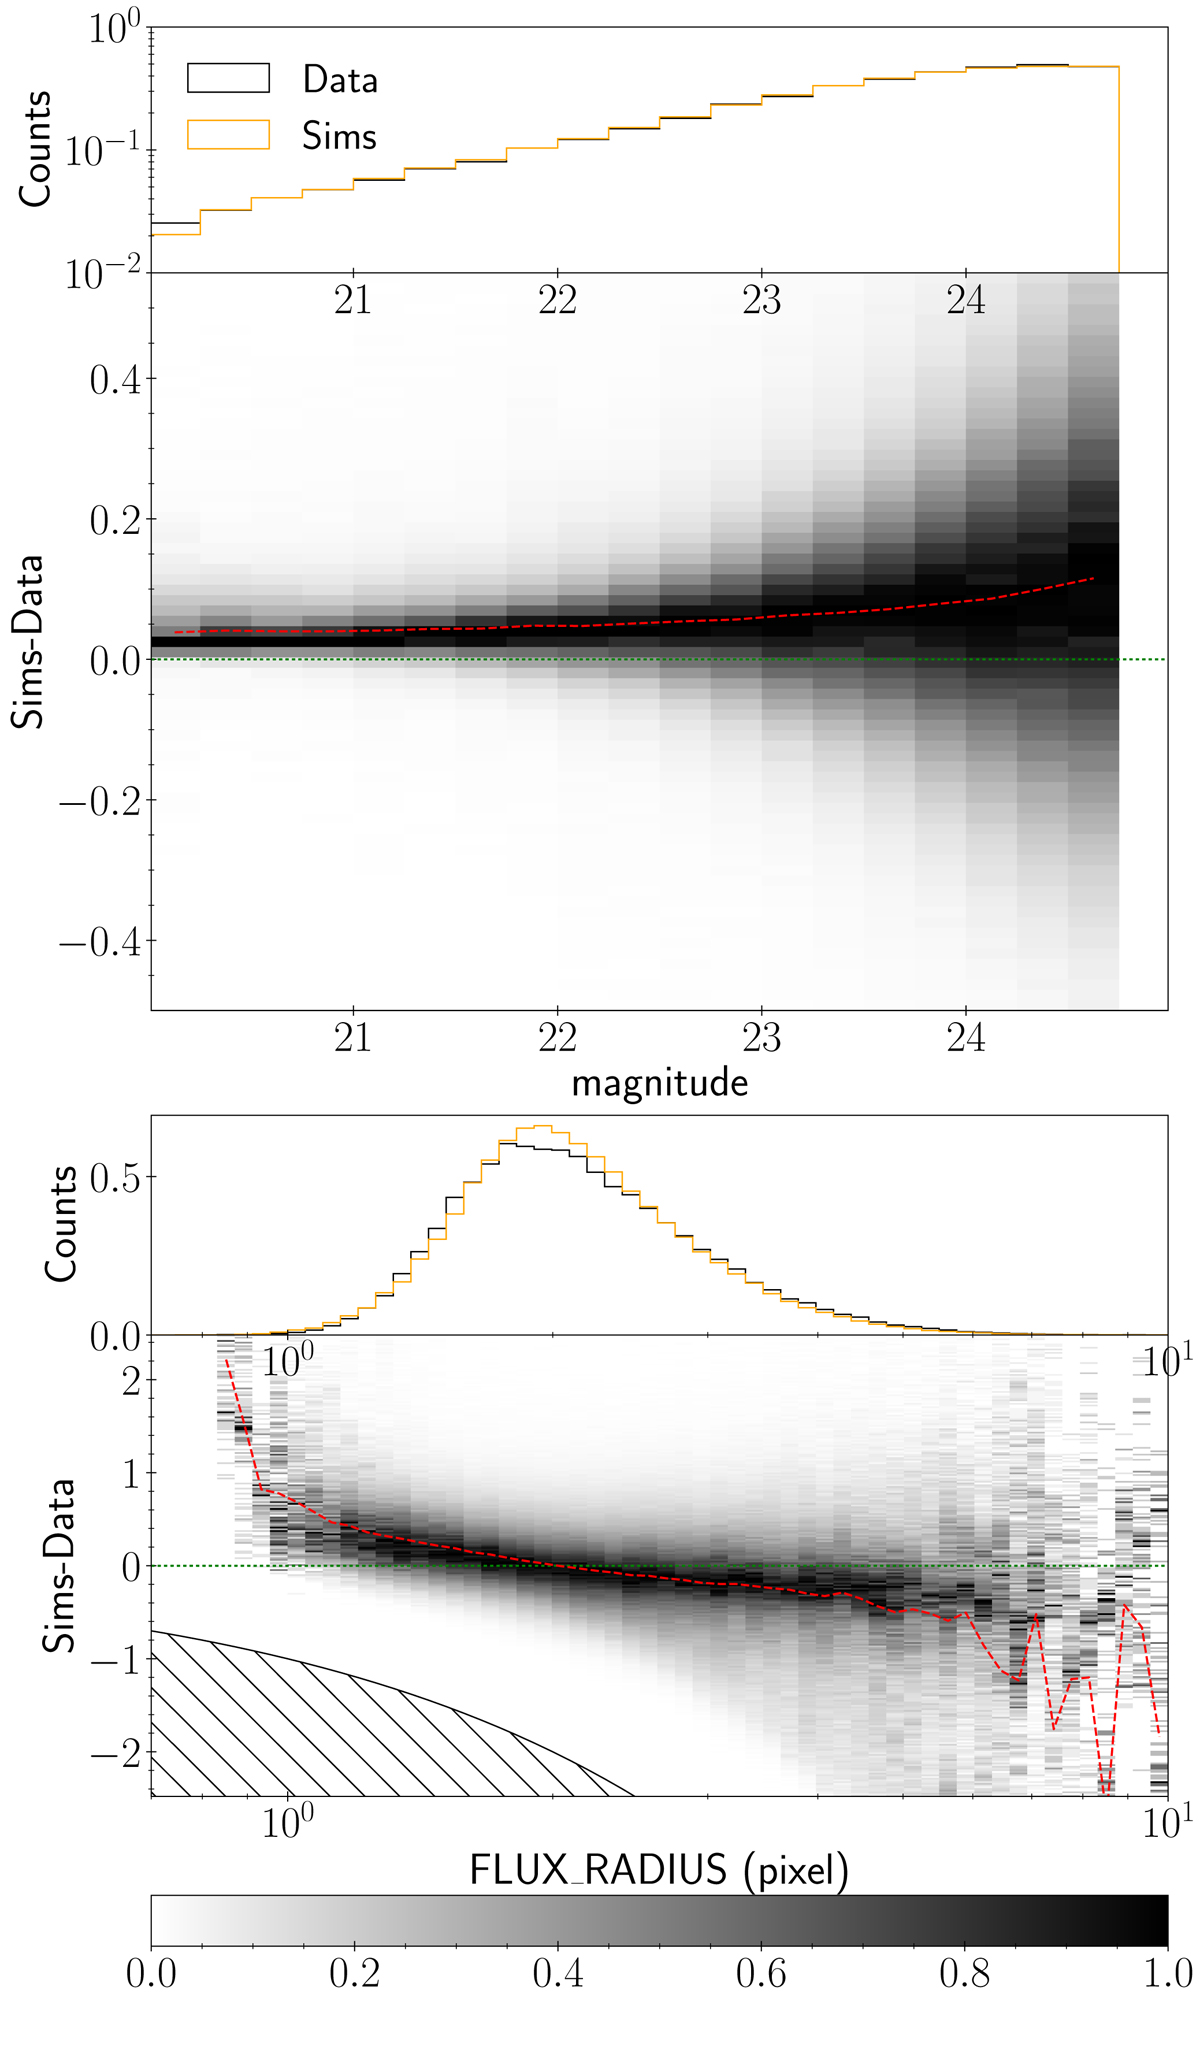
Object-by-object comparison of SEXTRACTOR quantities. Upper panels: unweighted histograms for measurements from the KiDS COSMOS field and our simulated data. Lower panels: 2D histograms with the difference between the simulations and the data along the vertical axis and the quantity of interest along the horizontal axis. Each vertical column is normalised such that each peak in the 1-dimensional slices of the 2D histogram is normalised to unity. This improves the histogram visually, allowing us to see the contrast across the full parameter range. The shaded region in the bottom figure indicates where the corresponding quantities in the simulations are negative. The red dashed lines show the median values, which indicate that the agreement between the simulations and the data is generally good.
Current usage metrics show cumulative count of Article Views (full-text article views including HTML views, PDF and ePub downloads, according to the available data) and Abstracts Views on Vision4Press platform.
Data correspond to usage on the plateform after 2015. The current usage metrics is available 48-96 hours after online publication and is updated daily on week days.
Initial download of the metrics may take a while.