Fig. 2.
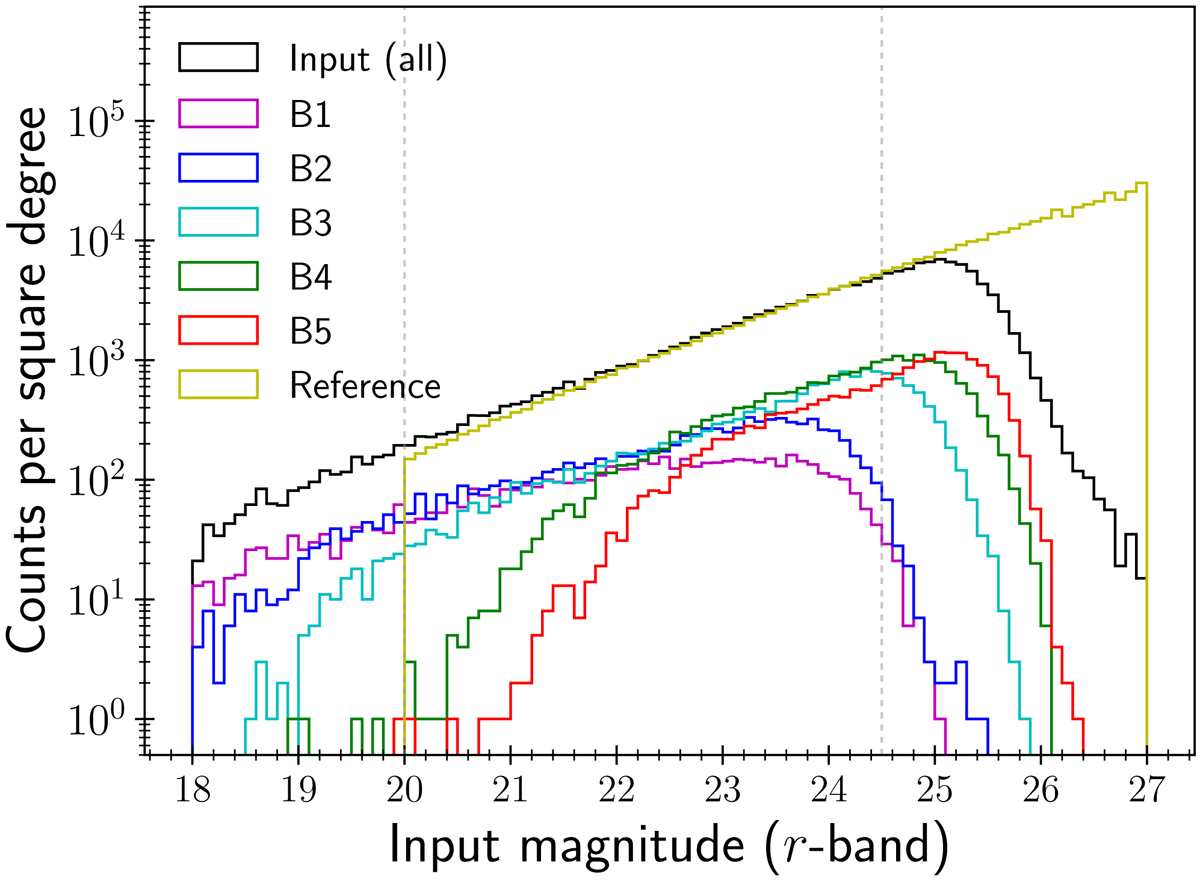
Distribution of input magnitudes for all the galaxies (black) and the distributions when the galaxies are divided into the tomographic bins based on their “true” redshifts. The analytic magnitude distribution used in FC17 is given in yellow for reference. The region enclosed by the vertical lines denotes the range in the output magnitude for which shapes are measured.
Current usage metrics show cumulative count of Article Views (full-text article views including HTML views, PDF and ePub downloads, according to the available data) and Abstracts Views on Vision4Press platform.
Data correspond to usage on the plateform after 2015. The current usage metrics is available 48-96 hours after online publication and is updated daily on week days.
Initial download of the metrics may take a while.