Fig. 13.
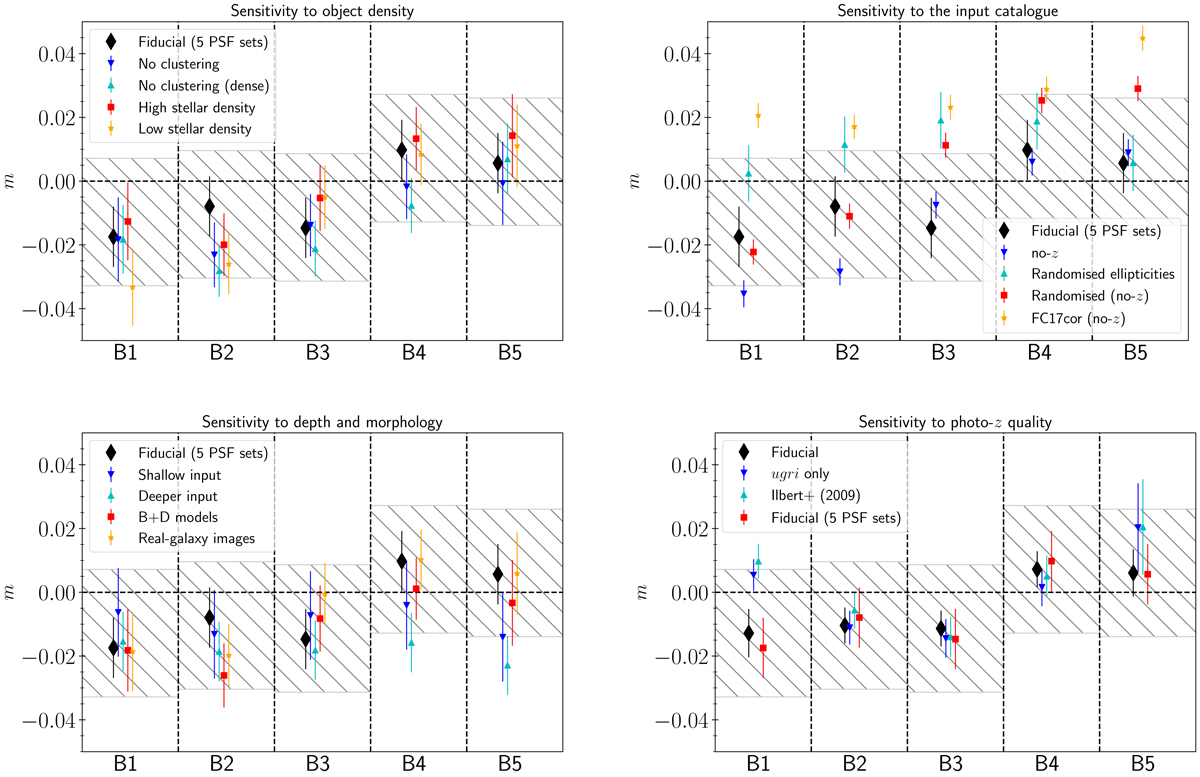
Residual biases calculated with different simulations indicating the robustness of our calibration to different assumptions about the input to the simulations. Top-left: sensitivity to galaxy clustering and number density (Sect. 7.1 and Sect. 7.2). Top-right: sensitivity to input ellipticity correlations with galaxy parameters (Sect. 7.3). Bottom-left: sensitivity to the magnitude completeness of the input catalogue (Sect. 7.4) and to galaxy model in the simulations (Sect. 7.5). Bottom-right: sensitivity to the quality of photo-zs (Sect. 7.6). The hatched regions in the all panels are indicate the ±0.02 region around the fiducial values of each panel (black diamonds).
Current usage metrics show cumulative count of Article Views (full-text article views including HTML views, PDF and ePub downloads, according to the available data) and Abstracts Views on Vision4Press platform.
Data correspond to usage on the plateform after 2015. The current usage metrics is available 48-96 hours after online publication and is updated daily on week days.
Initial download of the metrics may take a while.