Fig. 11.
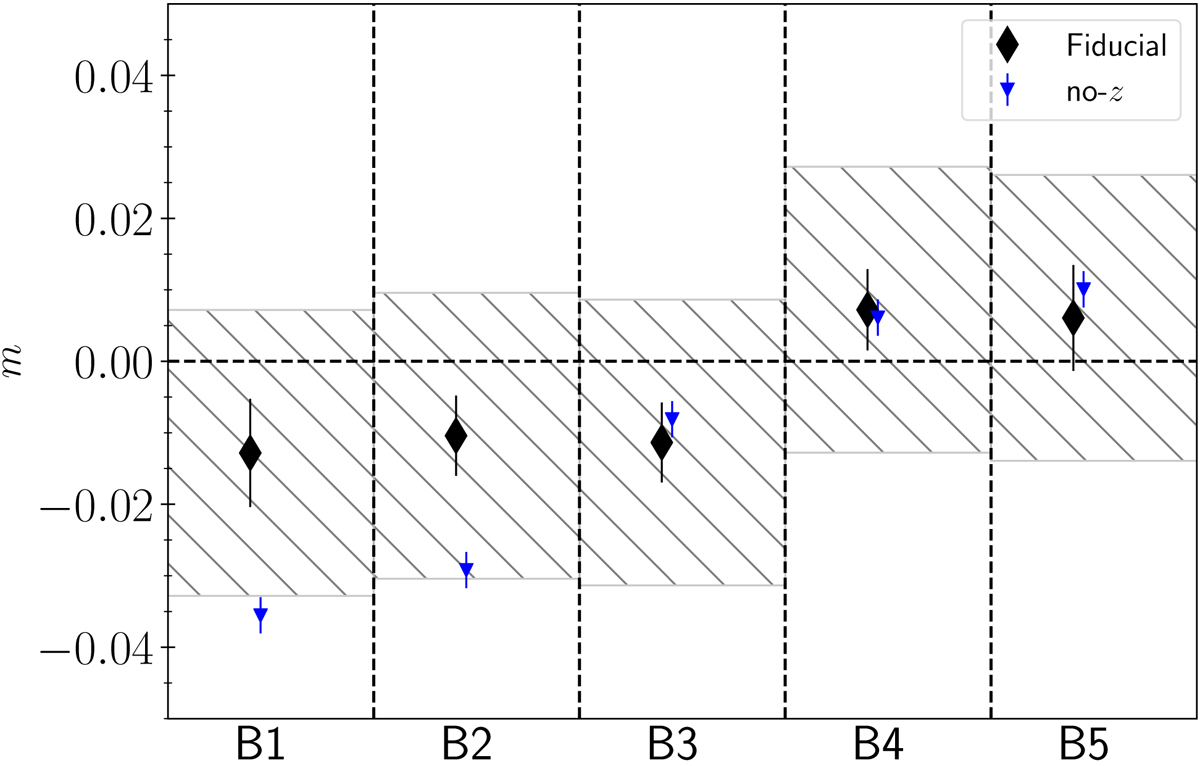
Multiplicative bias calculated using the re-weighting technique as a function of tomographic bins used in the KV-450 cosmic shear analysis. The black diamonds correspond to the fiducial bias values obtained after tomographic splitting of the simulated galaxy population, while the blue downward pointing triangles correspond to the bias values obtained without such a splitting. The hatched regions indicate the ±0.02 region around the fiducial values.
Current usage metrics show cumulative count of Article Views (full-text article views including HTML views, PDF and ePub downloads, according to the available data) and Abstracts Views on Vision4Press platform.
Data correspond to usage on the plateform after 2015. The current usage metrics is available 48-96 hours after online publication and is updated daily on week days.
Initial download of the metrics may take a while.