Free Access
Fig. 8.
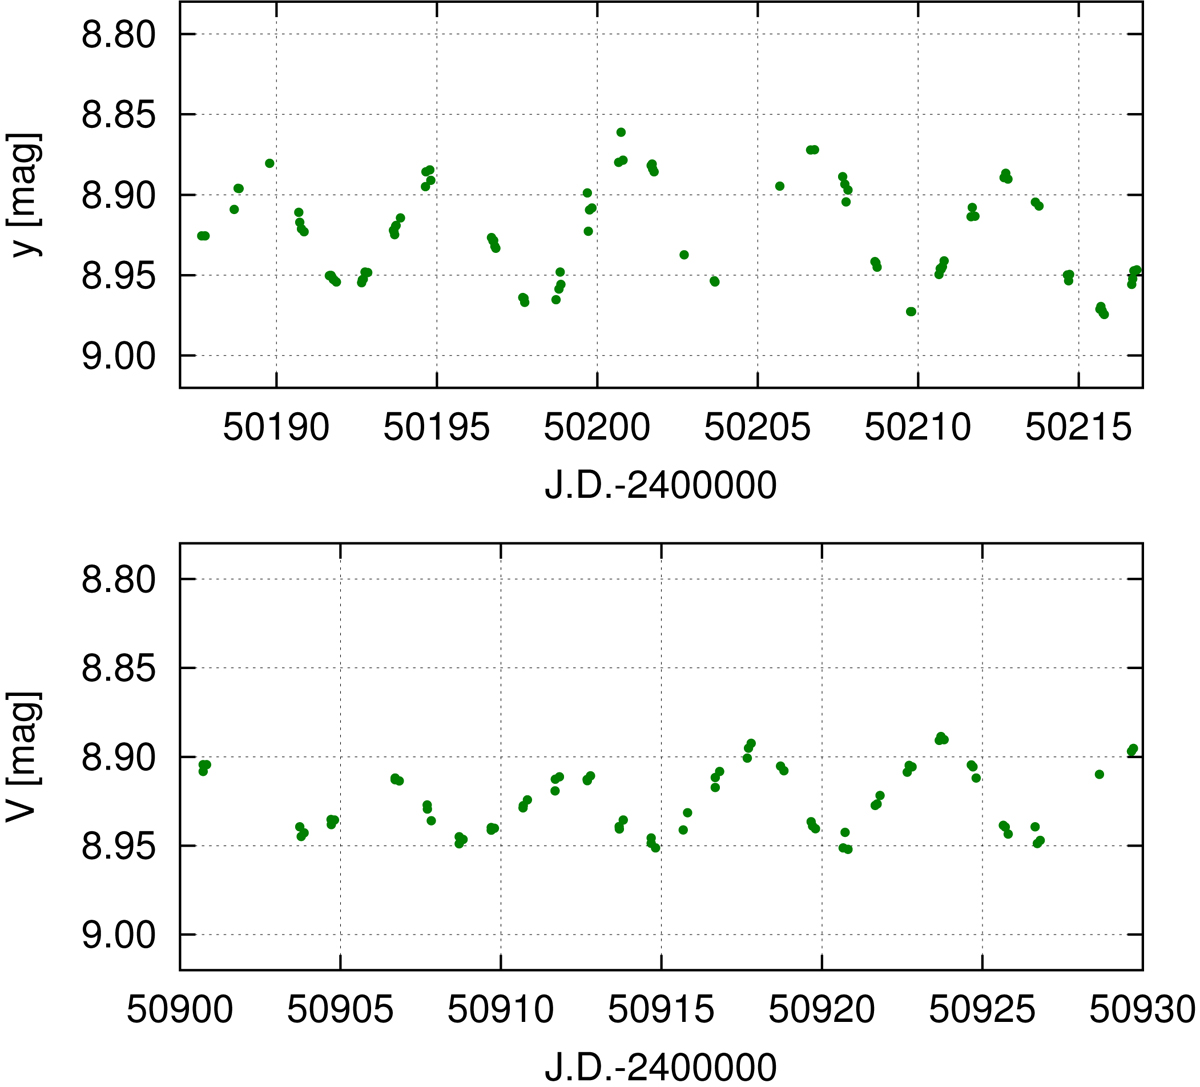
Well-sampled photometric modulation indicates the solidity of the 5.9 day period. Light curves were taken during April and May 1996 (top) and April 1998 (bottom) with the T7 and T6 APTs, respectively. The light curves even show the changing amplitudes and shapes typical for star spot evolution.
Current usage metrics show cumulative count of Article Views (full-text article views including HTML views, PDF and ePub downloads, according to the available data) and Abstracts Views on Vision4Press platform.
Data correspond to usage on the plateform after 2015. The current usage metrics is available 48-96 hours after online publication and is updated daily on week days.
Initial download of the metrics may take a while.