Fig. 7.
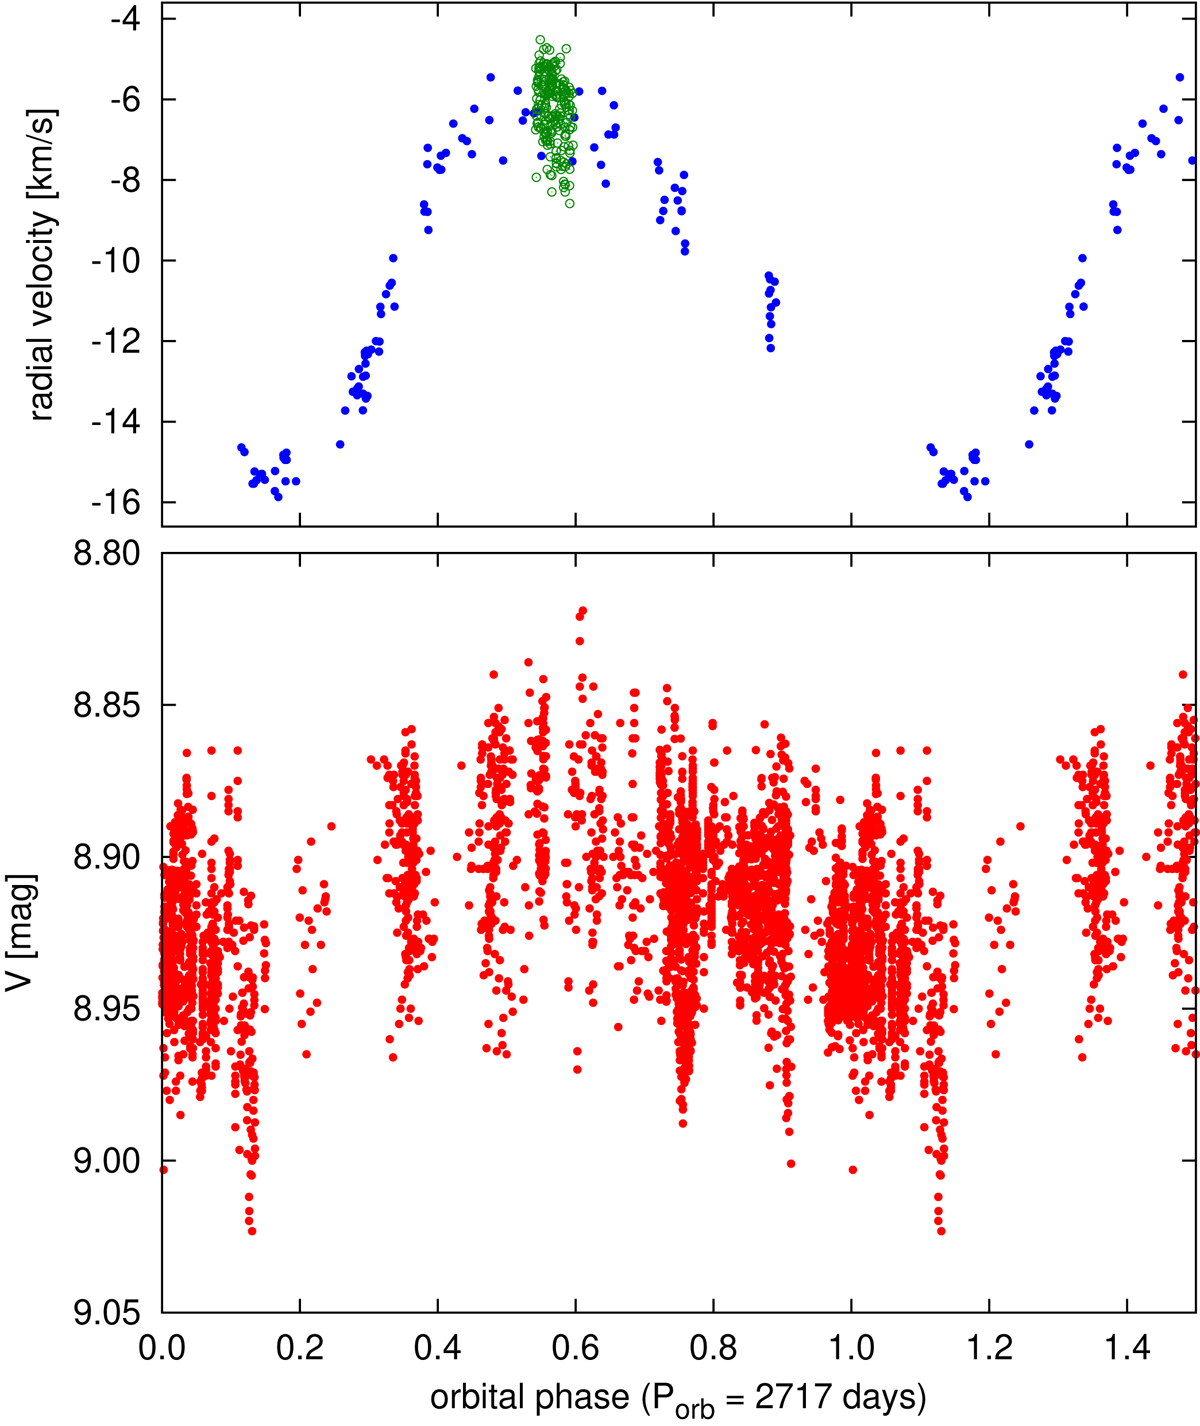
Comparing the long-term light variation with the radial velocity curve of IN Com. Top: radial velocity curve of the star taken from Jones et al. (2017) suggesting a 2717 day long orbital period. Overplotted are the radial velocities from our spectroscopic data (green circles). Bottom: long-term V + y photometric observations after folding up with the orbital period.
Current usage metrics show cumulative count of Article Views (full-text article views including HTML views, PDF and ePub downloads, according to the available data) and Abstracts Views on Vision4Press platform.
Data correspond to usage on the plateform after 2015. The current usage metrics is available 48-96 hours after online publication and is updated daily on week days.
Initial download of the metrics may take a while.