Fig. 5.
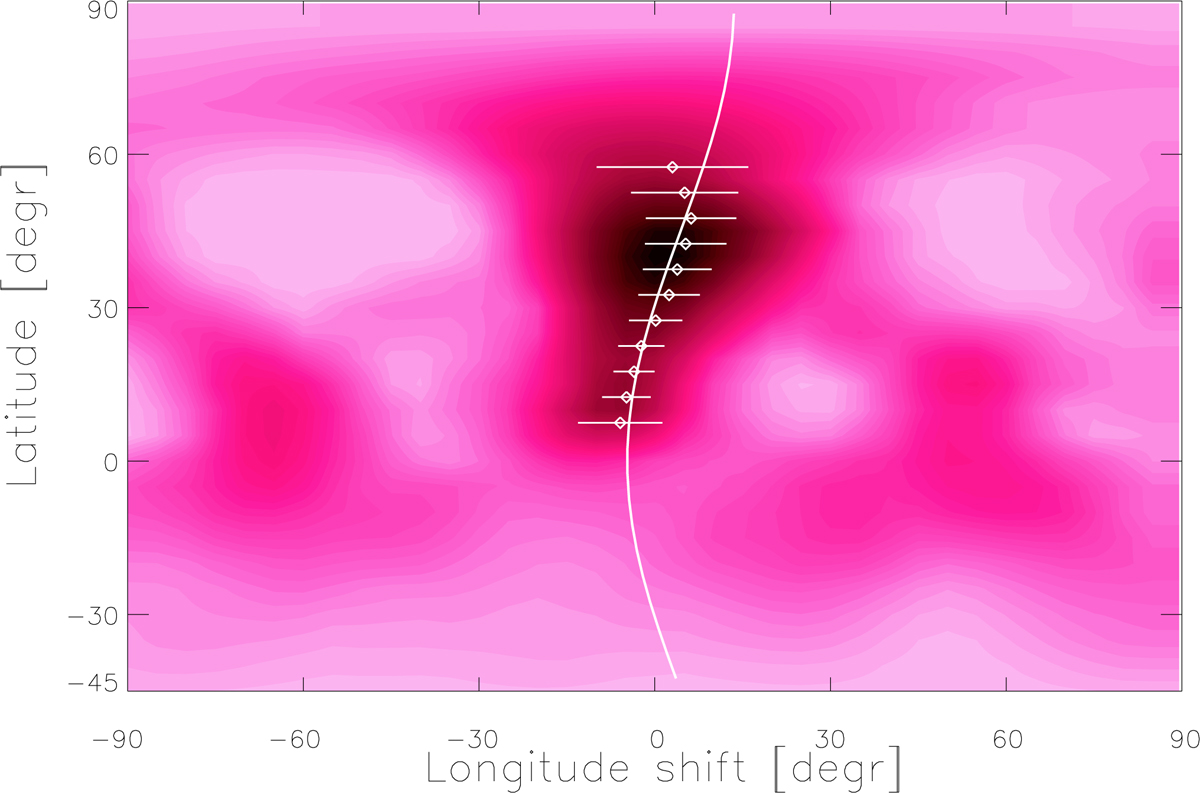
Average cross-correlation map for IN Com showing anti-solar surface differential rotation. The best correlated dark regions are fitted by Gaussian curves in 5° bins. Gaussian peaks are indicated by dots, the corresponding Gaussian widths by horizontal lines. The best fit differential rotation law suggests an equatorial period of Peq = 5.973 d and a surface shear coefficient of α = −0.026.
Current usage metrics show cumulative count of Article Views (full-text article views including HTML views, PDF and ePub downloads, according to the available data) and Abstracts Views on Vision4Press platform.
Data correspond to usage on the plateform after 2015. The current usage metrics is available 48-96 hours after online publication and is updated daily on week days.
Initial download of the metrics may take a while.