Fig. 4.
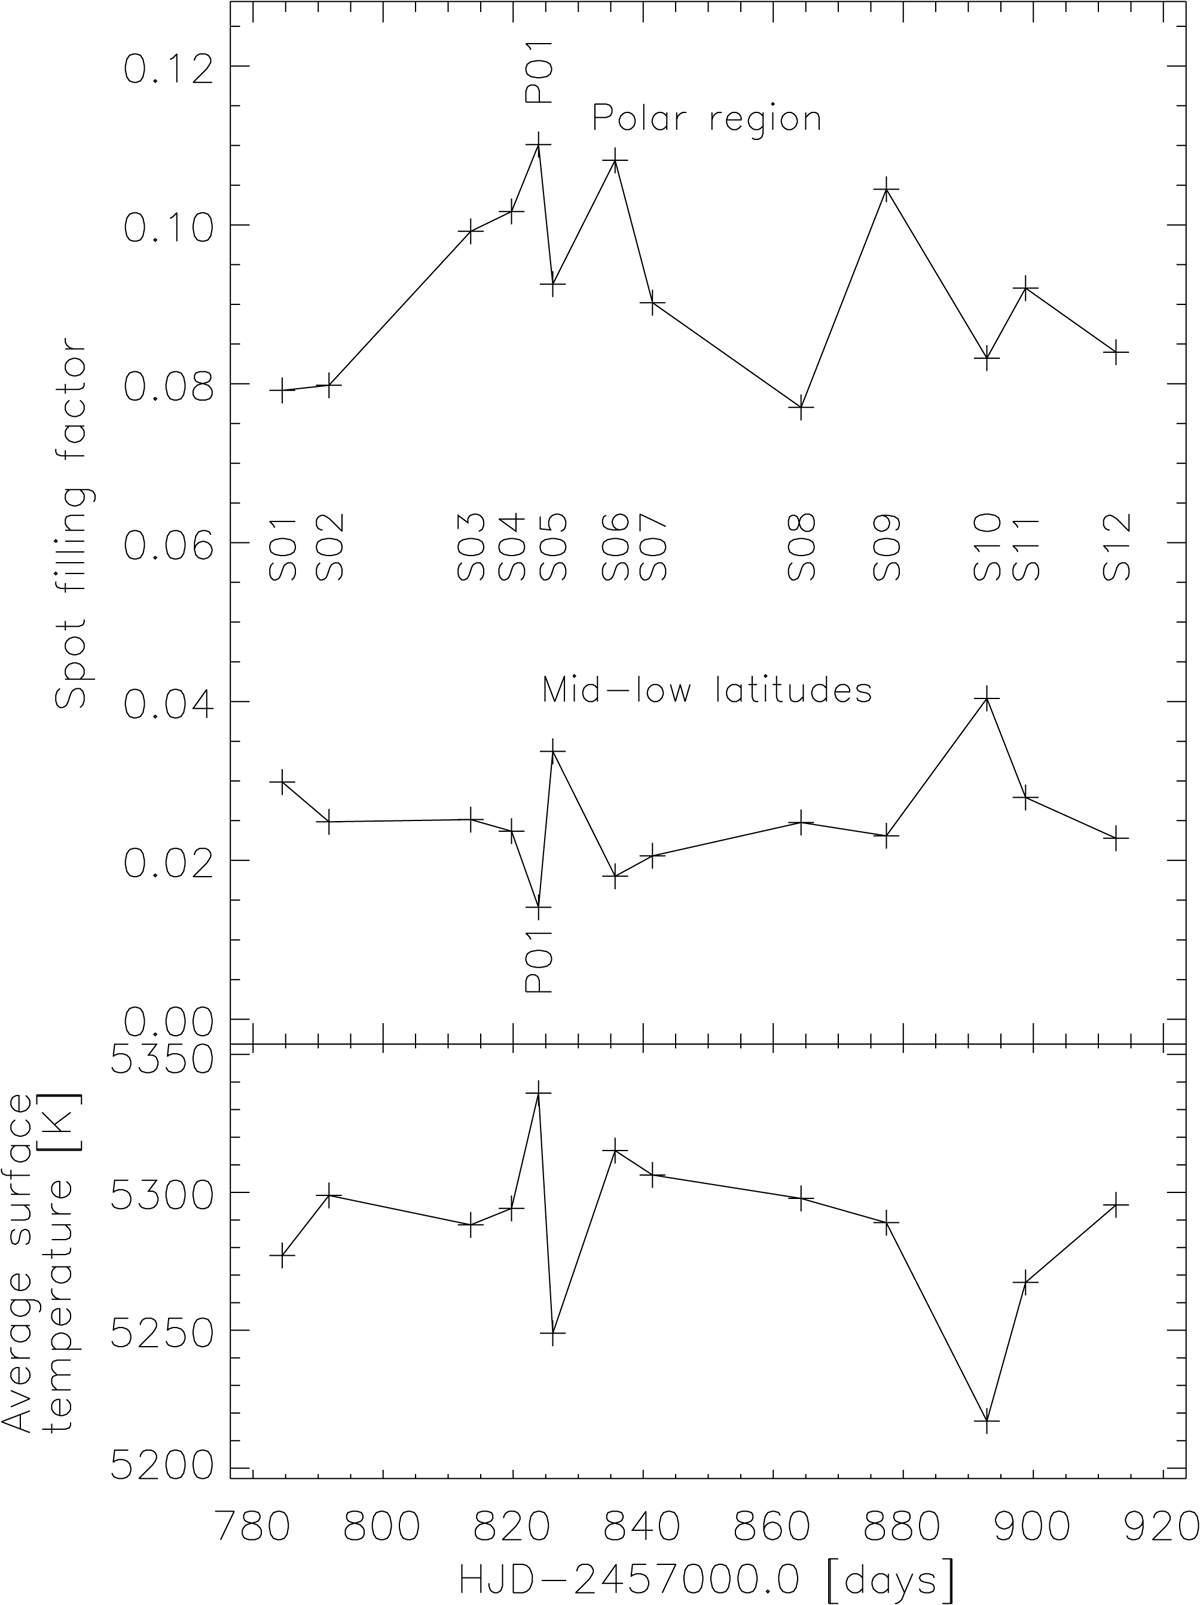
Time variation of the spot filling factor (top panel) and the integrated surface temperature (bottom panel) of IN Com derived from the time-series Doppler images shown in Figs. 1–3. Upper panel: the spot filling factors are shown for the polar region and for the mid-to-low latitudes separately; see the top and the bottom curves, respectively. The different Doppler reconstructions are identified by their serial numbers.
Current usage metrics show cumulative count of Article Views (full-text article views including HTML views, PDF and ePub downloads, according to the available data) and Abstracts Views on Vision4Press platform.
Data correspond to usage on the plateform after 2015. The current usage metrics is available 48-96 hours after online publication and is updated daily on week days.
Initial download of the metrics may take a while.