Free Access
Fig. A.2.
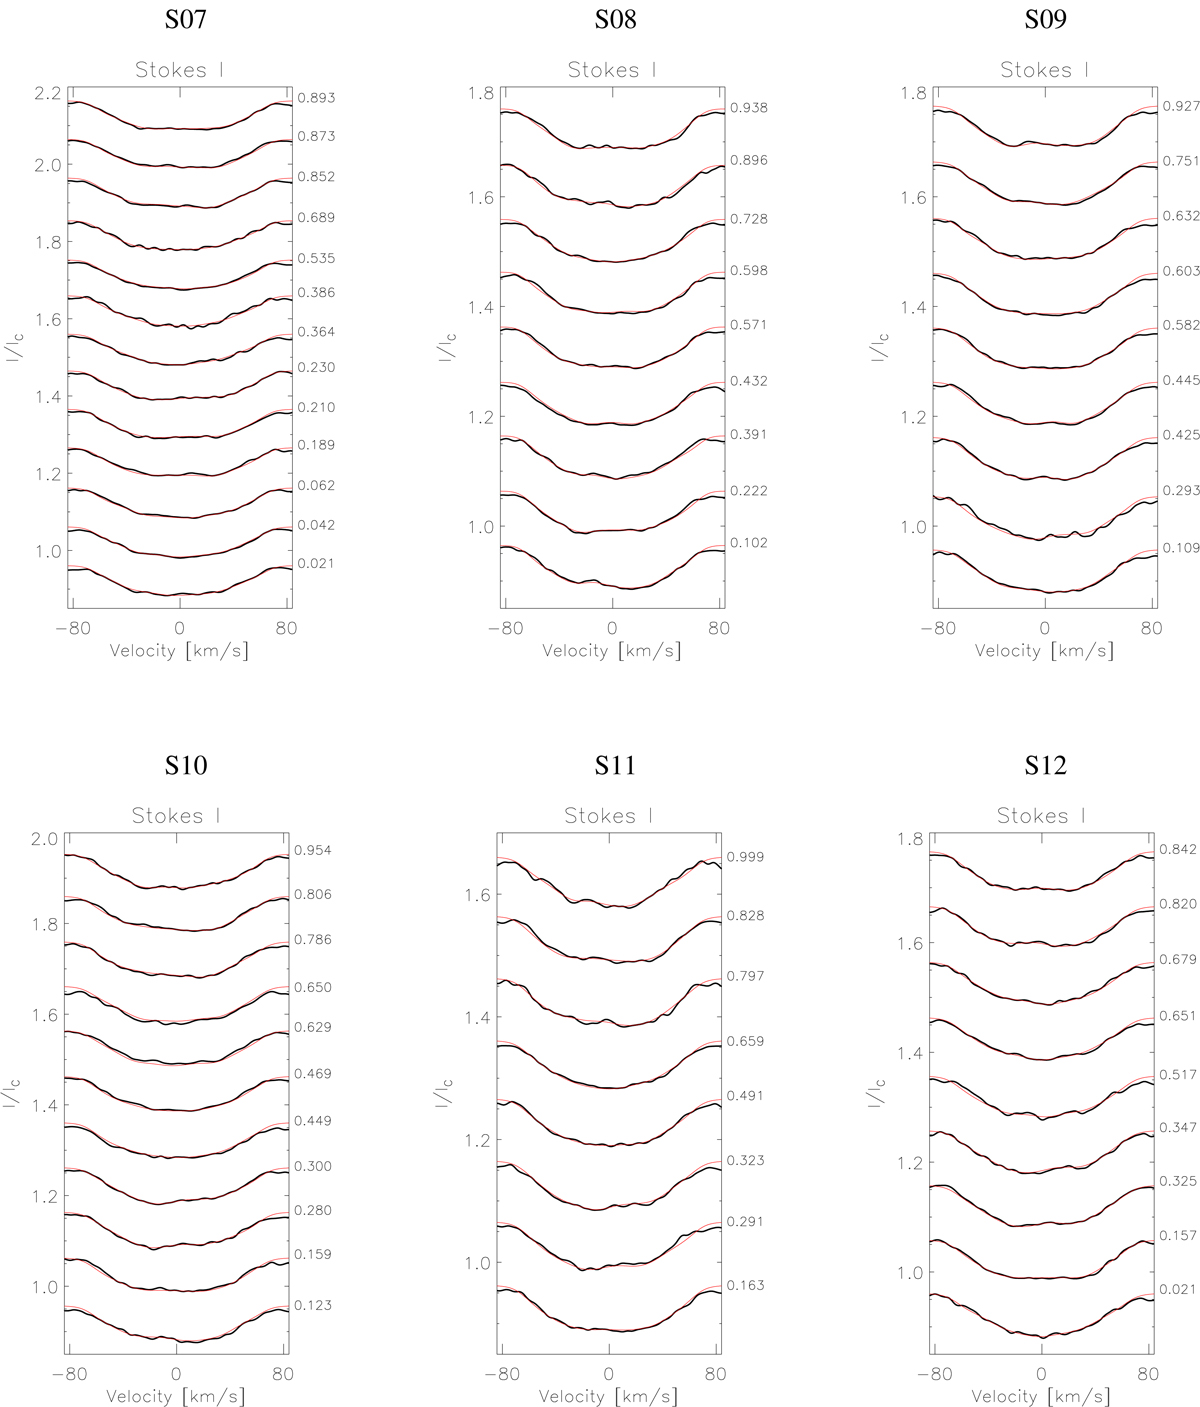
Observed line profiles (thick black lines) and their model fits (thin red lines) for the Doppler reconstructions S07–S12 shown in Fig. 2. The phases of the individual observations are listed on the right side of the panels.
Current usage metrics show cumulative count of Article Views (full-text article views including HTML views, PDF and ePub downloads, according to the available data) and Abstracts Views on Vision4Press platform.
Data correspond to usage on the plateform after 2015. The current usage metrics is available 48-96 hours after online publication and is updated daily on week days.
Initial download of the metrics may take a while.