Fig. 12.
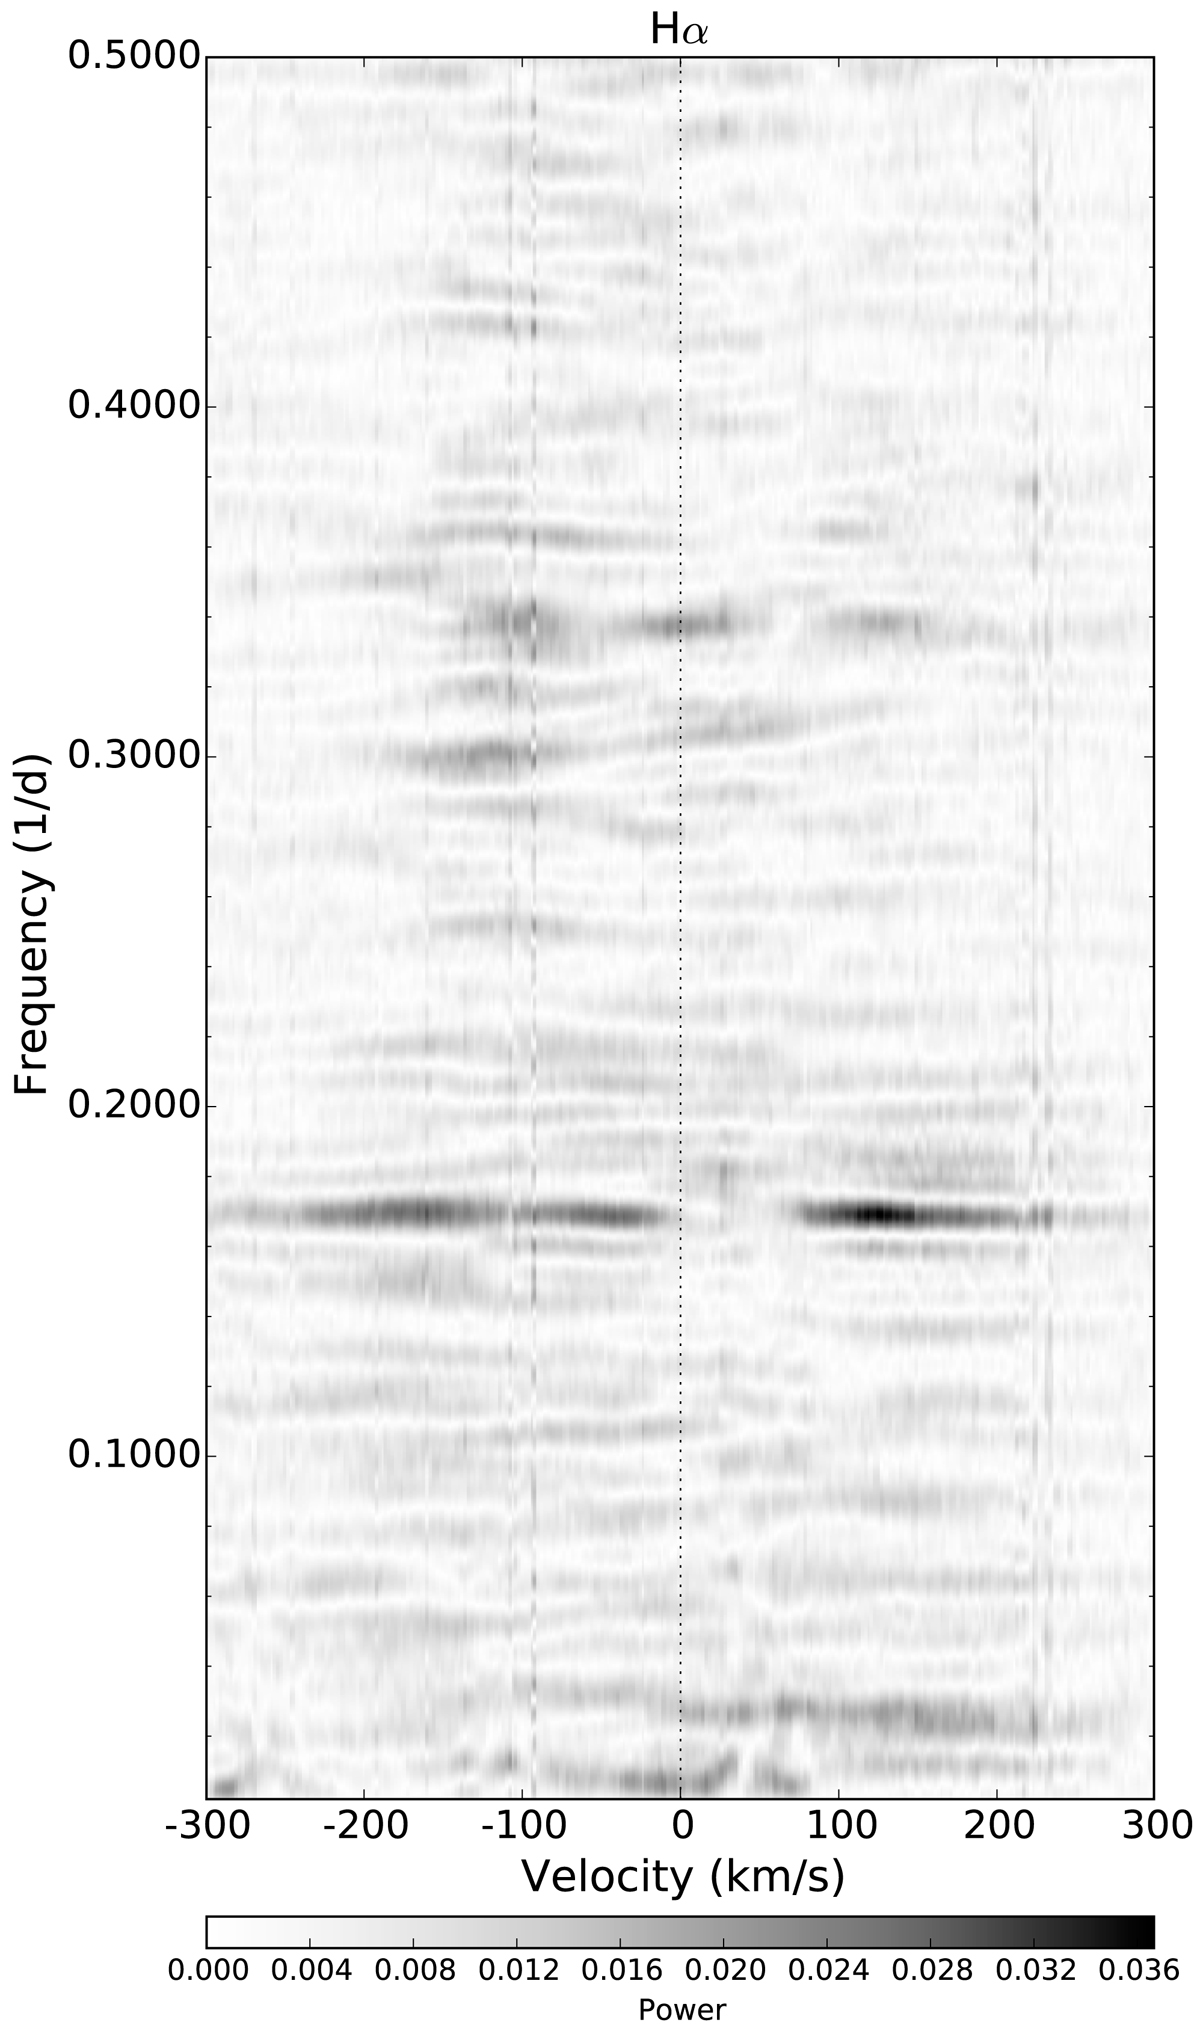
Two-dimensional Fourier periodogram of the time series Hα profile from Fig. 11. Spectral power is indicated in grey-scale. The plot’s horizontal range is ±300 km s−1 around the line core while its vertical range is from 470 d at the bottom to 2 d at the top. The dominant excess power is detected at a frequency of ∼0.17, corresponding to a period of 5.92 d.
Current usage metrics show cumulative count of Article Views (full-text article views including HTML views, PDF and ePub downloads, according to the available data) and Abstracts Views on Vision4Press platform.
Data correspond to usage on the plateform after 2015. The current usage metrics is available 48-96 hours after online publication and is updated daily on week days.
Initial download of the metrics may take a while.