| Issue |
A&A
Volume 624, April 2019
|
|
|---|---|---|
| Article Number | A5 | |
| Number of page(s) | 5 | |
| Section | Planets and planetary systems | |
| DOI | https://doi.org/10.1051/0004-6361/201834789 | |
| Published online | 29 March 2019 | |
Cometary topography and phase darkening★
DLR Institute for Planetary Research, Rutherfordstarsse 2,
12489
Berlin,
Germany
e-mail: This email address is being protected from spambots. You need JavaScript enabled to view it.
Received:
6
December
2018
Accepted:
18
January
2019
Abstract
Aims. Cometary surfaces can change significantly and rapidly as a result of the sublimation of their volatile material. Many authors have investigated this evolution; topographic data from all comets visited by spacecrafts have been used previously to derive a quantitative model that relates large-scale roughness (i.e. topography) with the evolution state of the nucleus for Jupiter-family comets (JFCs). Ground-based observers have published measurements of the phase functions of many JFCs and reported a trend in the phase darkening, with primitive objects showing a stronger darkening than evolved objects.
Methods. We used a numerical implementation of this previous topographic description to build virtual comets and measure the phase darkening induced by the different levels of macro-roughness. We then compared our model with other published values.
Results. We find that pure geometric effects such as self-shadowing can represent up to 22% of the darkening that is observed for more primitive objects, and 15% for evolved surfaces. This shows that although physical and chemical properties remain the main contributor to the phase darkening, the additional effect of the topography cannot be neglected.
Key words: comets: general
The code is only available at the CDS via anonymous ftp to cdsarc.u-strasbg.fr (130.79.128.5) or via http://cdsarc.u-strasbg.fr/viz-bin/qcat?J/A+A/624/A5
© ESO 2019
1 Introduction
Determining the age of a cometary surface is challenging. As the sublimation of volatile material ejects gas and refractory elements from the surface, most of this material is lost to space. It is estimated that the surface of a typical Jupiter-family comet (JFC) such as 9P/Tempel 1 or 67P/Churyumov-Gerasimenko (67P) on average loses several meters per orbit (e.g., Pätzold et al. 2016 for 67P). In detail, this loss is mostly concentrated in specific areas of the nucleus where tens of meters of material can be removed, while other areas remain unchanged (e.g., Thomas et al. 2007; El-Maarry et al. 2017 for 9P and 67P, respectively). Most of the physical processes involved in this erosional activity remain to be understood, especially concerning the timescale on which they occur. This explains why it is difficult to accurately measure how evolved a nucleus is. This is a critical measurement that we need to obtain in order to understand the solar system evolution, however. As comets are thought to be remnants of early accretion, protoplanetesimals that never became larger, we must understand how much of the surface we observe now is indeed pristine and represents these initial conditions. The question is whether the morphological and chemical features we observe are primitive or if they rather reflect the evolutionary processes at work.
Many authors have discussed cometary evolution, and much progress has been made through ESA’s Rosetta mission, which followed comet 67P from 2014 to 2016 through its perihelion passage. Detailed information about the evolutionary erosion observed on this comet can be found in El-Maarry et al. (2017), Birch et al. (2017), Vincent et al. (2017), and Vincent (2018).
Of course, 67P is not the only comet visited by a spacecraft, and the morphological features of six nuclei have been measured so far, twice in the case of comet 9P, which was observed by the two NASA missions Deep Impact (A’Hearn et al. 2005) and Stardust/NEXT (A’Hearn et al. 2011). Vincent et al. (2017) combined the data from these observations and extracted a statistical description of the topography of cometary nuclei. They proposed that the surfaces of JFCs, more exactly, the cumulative size distribution of the height of topographic features, can be accurately described by power laws. The power slope of this distribution provides a measure of the evolution state of the surface. They measured that primitive nuclei display a shallower power law (slope = −1.5), while evolved surfaces have a steeper distribution (slope = −2.3). In effect, this means that primitive surfaces are characterized by a rough topography on a large scale, with deep pits and tall cliffs throughout the nucleus, which may be a signature of the early collisional environment or large outbursts during the first orbit in the inner solar system. Conversely, evolved nuclei are better described as being quite smooth, and most features are erased by the activity. This concept is summarized in the left panel of Fig. 1.
While our results are consistent with all in situ observations so far and are supported by modeling of the thermal processes at play (Keller et al. 2015; Vincent et al. 2017), we are limited by the fact that only a few comets have been observed with enough accuracy to measure the power law described above. We cannot currently constrain the timescale of this resurfacing because of the large uncertainty in the orbital evolution of JFCs beyond their last close encounter with Jupiter (see, e.g., the discussion in Ip et al. 2016).
Thousands of additional observations are available from the ground-based observer community, however, and it should be possible to link some of their measured quantities (albedo, spectra, phase function, etc.) with evolution models. In a recent paper, Kokotanekova et al. (2018) measured the phase function of 14 JFCs, 10 of which had not been visited by space missions so far. They reported on a remarkable trend in the slope of the phase function, which shows an increase in phase darkening for objects considered the most primitive (based on the current understanding of their orbital evolution). In other words, primitive comets appear relatively darker at large phase angle.
As these comets are assumed to share similar composition and physical properties, Kokotanekova et al. (2018) argued that they might be observing a signature of the erosion processes described in Vincent et al. (2017): primitive surfaces, with their tall cliffs and deep pits, will display far more shadows at high phase than smooth, eroded nuclei. This results in the higher phase darkening described above. Here, we test this hypothesis numerically, with the aim to derive a law that connects evolution and phase darkening.
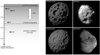 |
Fig. 1 Left panel: model of cometary evolution proposed by Vincent et al. (2017). Right panel: simulated primitive and evolved topography compared to real nuclei that are assumed to belong to these categories. |
2 Methods
2.1 Procedural generation of comets
Previously, Shepard & Campbell (1998) investigated the photometric effects of roughness on planetary surfaces at the smallest scale at which shadows can be produced, using a fractal description of the surface. In this work, we consider the largest scale roughness of the surface, that is, morphological features that are clearly identified and cataloged by space missions, and which typically span distances of ten to several hundred meters. These are typially larger than a few tens of meters. Small-scale variation of roughnessis also an important parameter to be studied, and we refer to Thomas et al. (2018) for the regional distribution of micro-roughness on comet 67P, to Marshall et al. (2018) for its effects on Rosetta measurements in visible, infrared, and microwaves, and to Longobardo et al. (2017) on photometry as an indicator of cometary surface roughness at small scales.
To evaluate the effect of topography on the phase darkening, we must first define this topography and specify their spatial distribution, that is, the lateral, and vertical extent, as a function of the comet age. Fortunately, the topography of comets at scales largerthan 10 m is relatively easy to describe and is dominated by either smooth plains or rough terrains scarred with pits and cliffs. The latter are mostly associated with partial or fully formed pits on all comets, except for a few retreating scarps at the edge of smooth regions on 9P or 67P (e.g., Thomas et al. 2013, 2015; Groussin et al. 2015). In order to build this topography procedurally with a computer, we need to define the number of pits per cometary nucleus, their spatialdistribution, their diameter, and their depth. We achieve this based on the following assumptions:
-
The initial number of pits is calibrated from observations. Considering objects such as 67P or 81P as typical for primitive nuclei with diameters of 5 km (Birch et al. 2017; Vincent et al. 2017), we measured about 20 cliffs (or pit walls) of300 m height, which we used as a reference point for our distribution. Larger cliffs are observed, but their numbersare not well constrained; the gravitational field on small bodies can change greatly across short distances, and what looks like a large wall may not be vertical throughout its surface (see the discussion in Vincent et al. 2017).
-
The number of cliffs of any size is given by the power laws in Vincent et al. (2017). We used power slopes −1.5 for primitive surfaces and −2.3 for evolved ones.
-
Depth and diameter of pits are correlated. Vincent et al. (2015) and Ip et al. (2016) measured a depth-to-diameter ratio of 0.73 ± 0.08 for the most recently formed features, down to an impact-crater-like ratio of 0.2 for more evolved pits on JFCs.
-
Observations of pits on 81P (Brownlee et al. 2004) and 67P (Vincent et al. 2015) showed that their morphology is almost perfectly cylindrical and not conical or bowl shaped.
Based on these assumptions, we generated a distribution of pits and created a virtual comet by carving out cylinders with these calculated dimensions from an initial sphere of 5 km. This was done with a Python script running in the free and open source 3D creation software suite Blender1. The code and one example file are available as supplementary material. Examples of comets generated with this technique are shown in the right panel of Fig. 1.
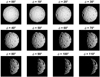 |
Fig. 2 “Evolved” virtual comet at various phase angles. The default Lambertian bidirectional scattering distribution function of Blender is applied to this model in the final rendering for aesthetic reasons only. Our calculations only consider whether a pixel is lit or in shadow, regardless of the photometric function being used. |
2.2 Area phase function
Positioning the observer and the Sun along the X-axis of the shape model thus generated, we rotated the comet-Sun vector around the Z-axis from 0° to 110° of phase in steps of 10°. At larger phases, when the Sun moves beyond the object horizon, the visible surface is in shadows and the phase function is controlled by the forward-scattering properties of the material rather than the topography.
For each phase angle, we raytraced the shadows cast by the topography and reported how much of the illuminated surface was visible to the observer. This gave us a measure of the geometric phase darkening. An example of the varying illumination conditions is shown in Fig. 2.
Its important to note that because we attempt to determine the contribution of topography to the phase function, we ignored all other parameters that might affect the photometry, such as chemical and physical properties (e.g., albedo variations across the surface, grain size, and refractory-to-ice ratio).
Because the albedo of dark asteroids or comets does not change much across the spectral range of most of the solar energy, we can relate the absolute magnitude H, the geometric albedo α, and the diameter D of an object with the simple relation (Harris & Harris 1997)
 (1)
(1)
where D is expressed inkilometers.
For each simulated phase, we measured the illuminated and visible surface area, converted it into an equivalent disk diameter (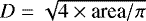 ), and derived its absolute magnitude by rewriting Eq. (1) as
![Mathematical equation: \begin{equation*}H = 5 \times [3.1236 - 0.5 \textrm{log}_{10}(\alpha)-\textrm{log}_{10}(D)].\end{equation*}](/articles/aa/full_html/2019/04/aa34789-18/aa34789-18-eq3.png) (2)
(2)
This gives us the photometric “area law” of our comets, which defines what an observer would measure if the comet brightness were a function of its illuminated surface alone (Lester et al. 1979).
It is important to note that this law only describes the reduction of the visible illuminated surface area and does not intend to replace a full photometric model such as Hapke (1993). We argue that on airless bodies (including objects such as comets, where the coma density close to the surface is extremely low), shadowed areas do not contribute to the overall brightness of the surface. It is true that some light scattering from nearby illuminated surfaces can allow resolving surface elements in shadows by stretching images acquired by spacecraft. However, the signal from these areas is close to the noise level and cannot be used for photometric measurements. It can be completely neglected for ground-based observations.
3 Results
We used the numerical approach described above to calculate the phase function of 40 procedurally generated comets (20 “primitive” and 20 “evolved”). We display the average results in Fig. 3.
As expected, the illuminated area is significantly reduced by increasing the large-scale roughness of the topography. This effect is strongest for phase angles between 60° and 70°, for which the illuminated visible area fraction of a primitive surface is 15%(±2) smaller than that of an evolved surface, and 25%(±2) smaller than for a smooth sphere. These results are easily understood qualitatively because an increase in topographic variations naturally leads to an increase in length of shadows at large phase angles, effectively masking large regions of the surface. For the same reason, north and south faces of mountains on Earth experience vastly different amounts of daylight, which leads to remarkable ecological differences between the two sides.
Incidentally, this effect has proven to be a great problem for the planning of Rosetta observations at comet 67P: even the subsolarpoint was not always illuminated because of the very rough topography in some areas (see the morphological description in Thomas et al. 2015).
After converting the illuminated area into absolute magnitude, we derived a phase darkening that can be compared with observationsby Kokotanekova et al. (2018). Our results are plotted in Fig. 4. We find that the self-shadowing created by the topography can result in a significant darkening of the surface. We note that this phase darkening is not linear and increases with the phase angle. Across the whole range, our model predicts a mean darkening of 0.011 ± 0.001 mag deg−1 for primitive or rough objects and 0.007 ± 0.0005 mag deg−1 for evolved or smooth objects, considering typical JFCs (diameter = 5 km, albedo = 5%).
We stress that this darkening is only due to the amount of shadows created by the topography. It should be interpreted as a correction factor to derive the effective surface that contributes to the observed brightness. After this correction is applied, a full photometricmodel still needs to be considered in order to derive meaningful physical properties of the surface material.
This geometric phase darkening is the derivative of Eq. (2) with respect to the phase function, and it therefore does not depend on the surface albedo (a constant measured at zero phase). Neither do we expect any dependence on the initial diameter if we assume that the power law describing the topography does not depend on the size of the object for comets of similar evolution status, which seems to be true for nuclei observed so far. The space in between our two curves in Fig. 4 should therefore encompass all cometary nuclei for which our topographic description is valid. The phase darkening appears to become quasi-linear for evolved objects because our smoothest modeled objects are close to spherical, and their visible illuminated surface area can be analytically described as (1 + cos(phase))∕2. This function is quasi-linear between about 60° and 120°, an effect that is emphasized when we apply a square root and logarithm functions to proceed from surface area to magnitude.
When compared with the measurements published by Kokotanekova et al. (2018), we find that self-shadowing could explain 22% of the phase darkening observed on a primitive object such as 81P/Wild 2 and 15% for evolved objects such as 9P/Tempel 1. The two values proposed here correspond to the roughest and smoothest cometary topographies that have been observed by spacecraft so far (81P or 67P, and 9P, respectively). Even smoother surfaces (e.g., 103P) barely show any topography, and the effect described here is irrelevant. On the other hand, it is possible to consider even rougher topographies, but this is highly speculative because we have no evidence that such extreme terrains could be formed.
While not responsible for all darkening, topography is definitely a component that cannot be ignored. This places constraints on the advanced photometric models (e.g., Hapke 1993), which should no longer consider the full phase darkening when the micro-roughness of the material is to be derived, but a reduced value corrected for the large-scale topographic effects by our model.
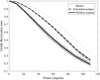 |
Fig. 3 Fraction of visible illuminated area for primitive and evolved comets as defined in the text, compared to a smooth sphere. Gray lines are all samples, 20 of each type, and black lines are the mean values. The standard deviation is ± 2%. |
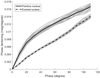 |
Fig. 4 Phase darkening as expected from self-shadowing that is due to topographic features on primitive and evolved cometary nuclei. |
4 Conclusions
From a statistical analysis of the distribution of large-scale topographic features, Vincent et al. (2017) proposed a model of cometary surface evolution that was able to predict the look of cometary nuclei as a function of their evolution status. Kokotanekova et al. (2018) and coauthors have observed significant variations in the amount of phase darkening observed for JFCs and suggested that it may also reflect how evolved those objects are.
In this follow-up work, we used our topographic model to generate virtual comets at different levels of evolution and calculate their phase darkening. Our numerical experiment suggests that topography can play a significant role in controlling the amount of observable illuminated surface area and the resulting brightness.
We find that pure geometric effects such as self-shadowing can represent up to 22% of the darkening observed for more primitive objects, and 15% for evolved surfaces. This shows that although physical and chemical properties remain the main contributor to the phase darkening, the additional effect of the topography cannot be neglected. The idea that objects showing the strongest darkening are also the most primitive. Kokotanekova et al. (2018) is consistent with the evolution model proposed by Vincent et al. (2017).
Acknowledgements
This research has made use of NASA’s Astrophysics Data System.
References
- A’Hearn, M. F., Belton, M. J. S., Delamere, W. A., et al. 2005, Science, 310, 258 [NASA ADS] [CrossRef] [PubMed] [Google Scholar]
- A’Hearn, M. F., Belton, M. J. S., Delamere, W. A., et al. 2011, Science, 332, 1396 [NASA ADS] [CrossRef] [Google Scholar]
- Birch, S. P. D., Tang, Y., Hayes, A. G., et al. 2017, MNRAS, 469, S50 [CrossRef] [Google Scholar]
- Brownlee, D. E., Horz, F., Newburn, R. L., et al. 2004, Science, 304, 1764 [NASA ADS] [CrossRef] [PubMed] [Google Scholar]
- El-Maarry, M. R., Groussin, O., Thomas, N., et al. 2017, Science, 355, 1392 [NASA ADS] [CrossRef] [Google Scholar]
- Groussin, O., Sierks, H., Barbieri, C., et al. 2015, A&A, 583, A36 [NASA ADS] [CrossRef] [EDP Sciences] [Google Scholar]
- Hapke, B. 1993, Theory of Reflectance and Emittance Spectroscopy (Cambridge: Cambridge University Press) [Google Scholar]
- Harris, A. W., & Harris, A. W. 1997, Icarus, 126, 450 [NASA ADS] [CrossRef] [Google Scholar]
- Ip, W.-H., Lai, I.-L., Lee, J.-C., et al. 2016, A&A, 591, A132 [NASA ADS] [CrossRef] [EDP Sciences] [Google Scholar]
- Keller, H. U., Mottola, S., Davidsson, B., et al. 2015, A&A, 583, A34 [NASA ADS] [CrossRef] [EDP Sciences] [Google Scholar]
- Kokotanekova,R., Snodgrass, C., Lacerda, P., et al. 2018, MNRAS, 479, 4665 [NASA ADS] [CrossRef] [Google Scholar]
- Lester, T. P., McCall, M. L., & Tatum, J. B. 1979, JRASC, 73, 233 [NASA ADS] [Google Scholar]
- Longobardo, A., Palomba, E., Capaccioni, F., et al. 2017, MNRAS, 469, S346 [CrossRef] [Google Scholar]
- Marshall, D., Groussin, O., Vincent, J.-B., et al. 2018, A&A, 616, A122 [NASA ADS] [CrossRef] [EDP Sciences] [Google Scholar]
- Pätzold, M., Andert, T., Hahn, M., et al. 2016, Nature, 530, 63 [NASA ADS] [CrossRef] [Google Scholar]
- Shepard, M. K., & Campbell, B. A. 1998, Icarus, 134, 279 [NASA ADS] [CrossRef] [Google Scholar]
- Thomas, P., A’Hearn, M., Belton, M. J. S., et al. 2013, Icarus, 222, 453 [NASA ADS] [CrossRef] [Google Scholar]
- Thomas, P. C., Veverka, J., Belton, M. J. S., et al. 2007, Icarus, 187, 4 [NASA ADS] [CrossRef] [Google Scholar]
- Thomas, N., Sierks, H., Barbieri, C., et al. 2015, Science, 347, aaa0440 [CrossRef] [Google Scholar]
- Thomas, N., El Maarry, M. R., Theologou, P., et al. 2018, Planet. Space Sci., 164, 19 [NASA ADS] [CrossRef] [Google Scholar]
- Vincent, J.-B. 2018, Lunar Planet. Sci. Conf., 49, 1280 [NASA ADS] [Google Scholar]
- Vincent, J.-B., Oklay, N., Marchi, S., Höfner, S., & Sierks, H. 2015, Planet. Space Sci., 107, 53 [NASA ADS] [CrossRef] [Google Scholar]
- Vincent, J.-B., Hviid, S. F., Mottola, S., et al. 2017, MNRAS, 469, S329 [CrossRef] [Google Scholar]
All Figures
|
Fig. 1 Left panel: model of cometary evolution proposed by Vincent et al. (2017). Right panel: simulated primitive and evolved topography compared to real nuclei that are assumed to belong to these categories. |
| In the text | |
|
Fig. 2 “Evolved” virtual comet at various phase angles. The default Lambertian bidirectional scattering distribution function of Blender is applied to this model in the final rendering for aesthetic reasons only. Our calculations only consider whether a pixel is lit or in shadow, regardless of the photometric function being used. |
| In the text | |
|
Fig. 3 Fraction of visible illuminated area for primitive and evolved comets as defined in the text, compared to a smooth sphere. Gray lines are all samples, 20 of each type, and black lines are the mean values. The standard deviation is ± 2%. |
| In the text | |
|
Fig. 4 Phase darkening as expected from self-shadowing that is due to topographic features on primitive and evolved cometary nuclei. |
| In the text | |
Current usage metrics show cumulative count of Article Views (full-text article views including HTML views, PDF and ePub downloads, according to the available data) and Abstracts Views on Vision4Press platform.
Data correspond to usage on the plateform after 2015. The current usage metrics is available 48-96 hours after online publication and is updated daily on week days.
Initial download of the metrics may take a while.