Free Access
Fig. 3
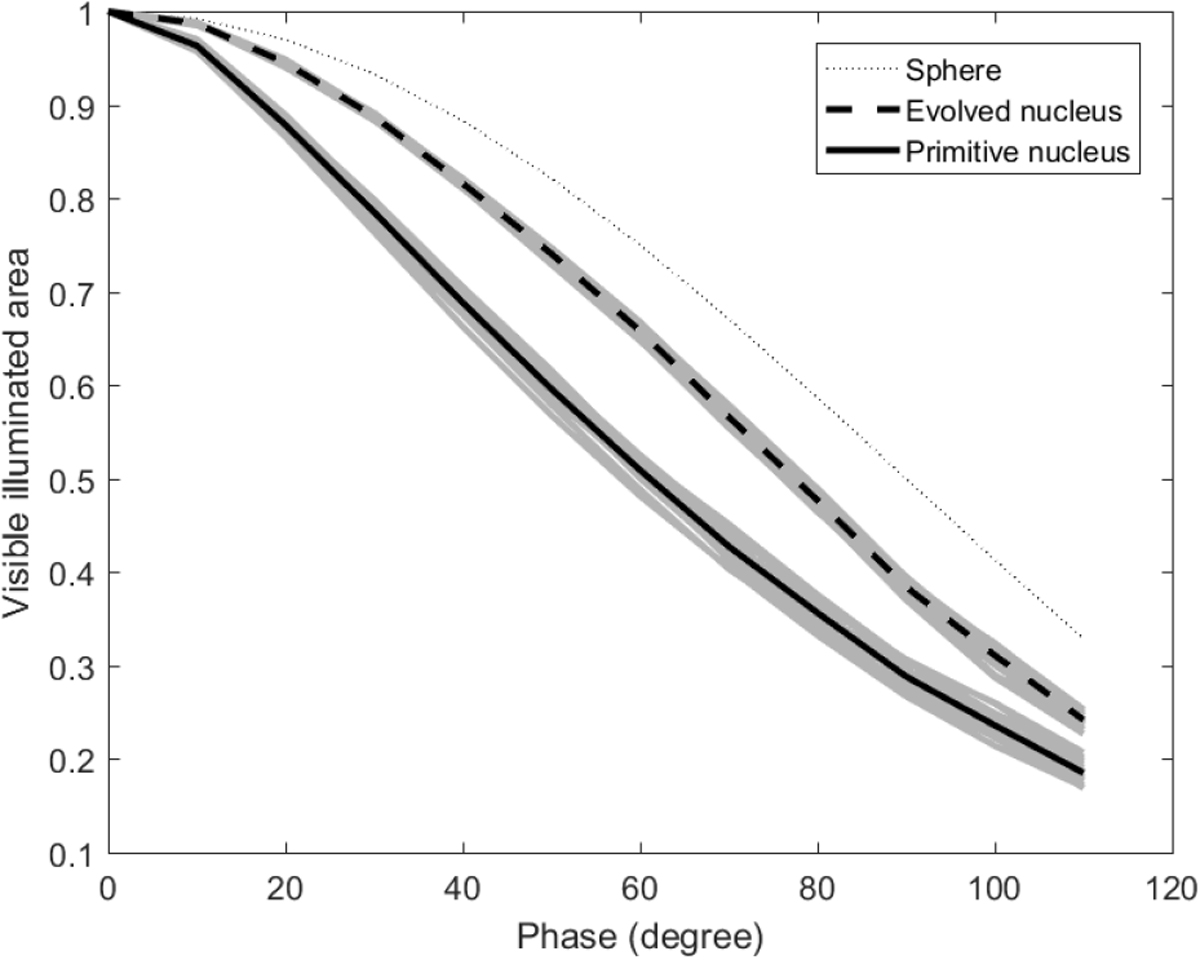
Fraction of visible illuminated area for primitive and evolved comets as defined in the text, compared to a smooth sphere. Gray lines are all samples, 20 of each type, and black lines are the mean values. The standard deviation is ± 2%.
Current usage metrics show cumulative count of Article Views (full-text article views including HTML views, PDF and ePub downloads, according to the available data) and Abstracts Views on Vision4Press platform.
Data correspond to usage on the plateform after 2015. The current usage metrics is available 48-96 hours after online publication and is updated daily on week days.
Initial download of the metrics may take a while.