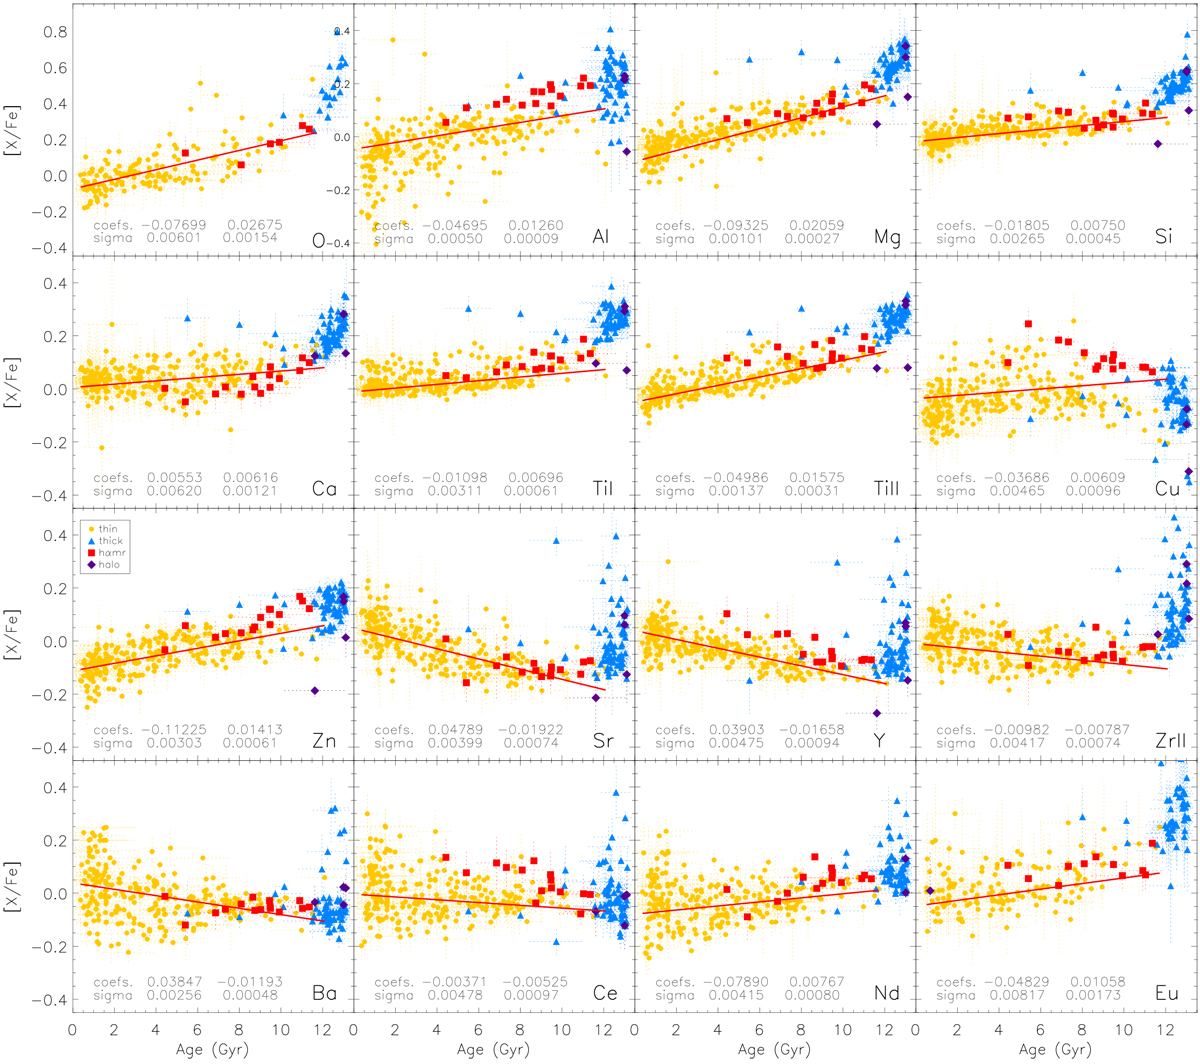
Fig. 7
Download original image
[X/Fe] as a function of age for stars with an error in age smaller than 1.5 Gyr. The different stellar populations are depicted with different colors and symbols as explained in the legend. We note the different size of y axis for oxygen with respect to the rest of elements. The red line is a weighted linear fit to the thin disk stars to guide the eye on the general behavior of the trends. The coefs. values in each panel are the abscissa origin and the slope of the fit, respectively, together with the error (σ) of each coefficient.
Current usage metrics show cumulative count of Article Views (full-text article views including HTML views, PDF and ePub downloads, according to the available data) and Abstracts Views on Vision4Press platform.
Data correspond to usage on the plateform after 2015. The current usage metrics is available 48-96 hours after online publication and is updated daily on week days.
Initial download of the metrics may take a while.