Fig. 4
Download original image
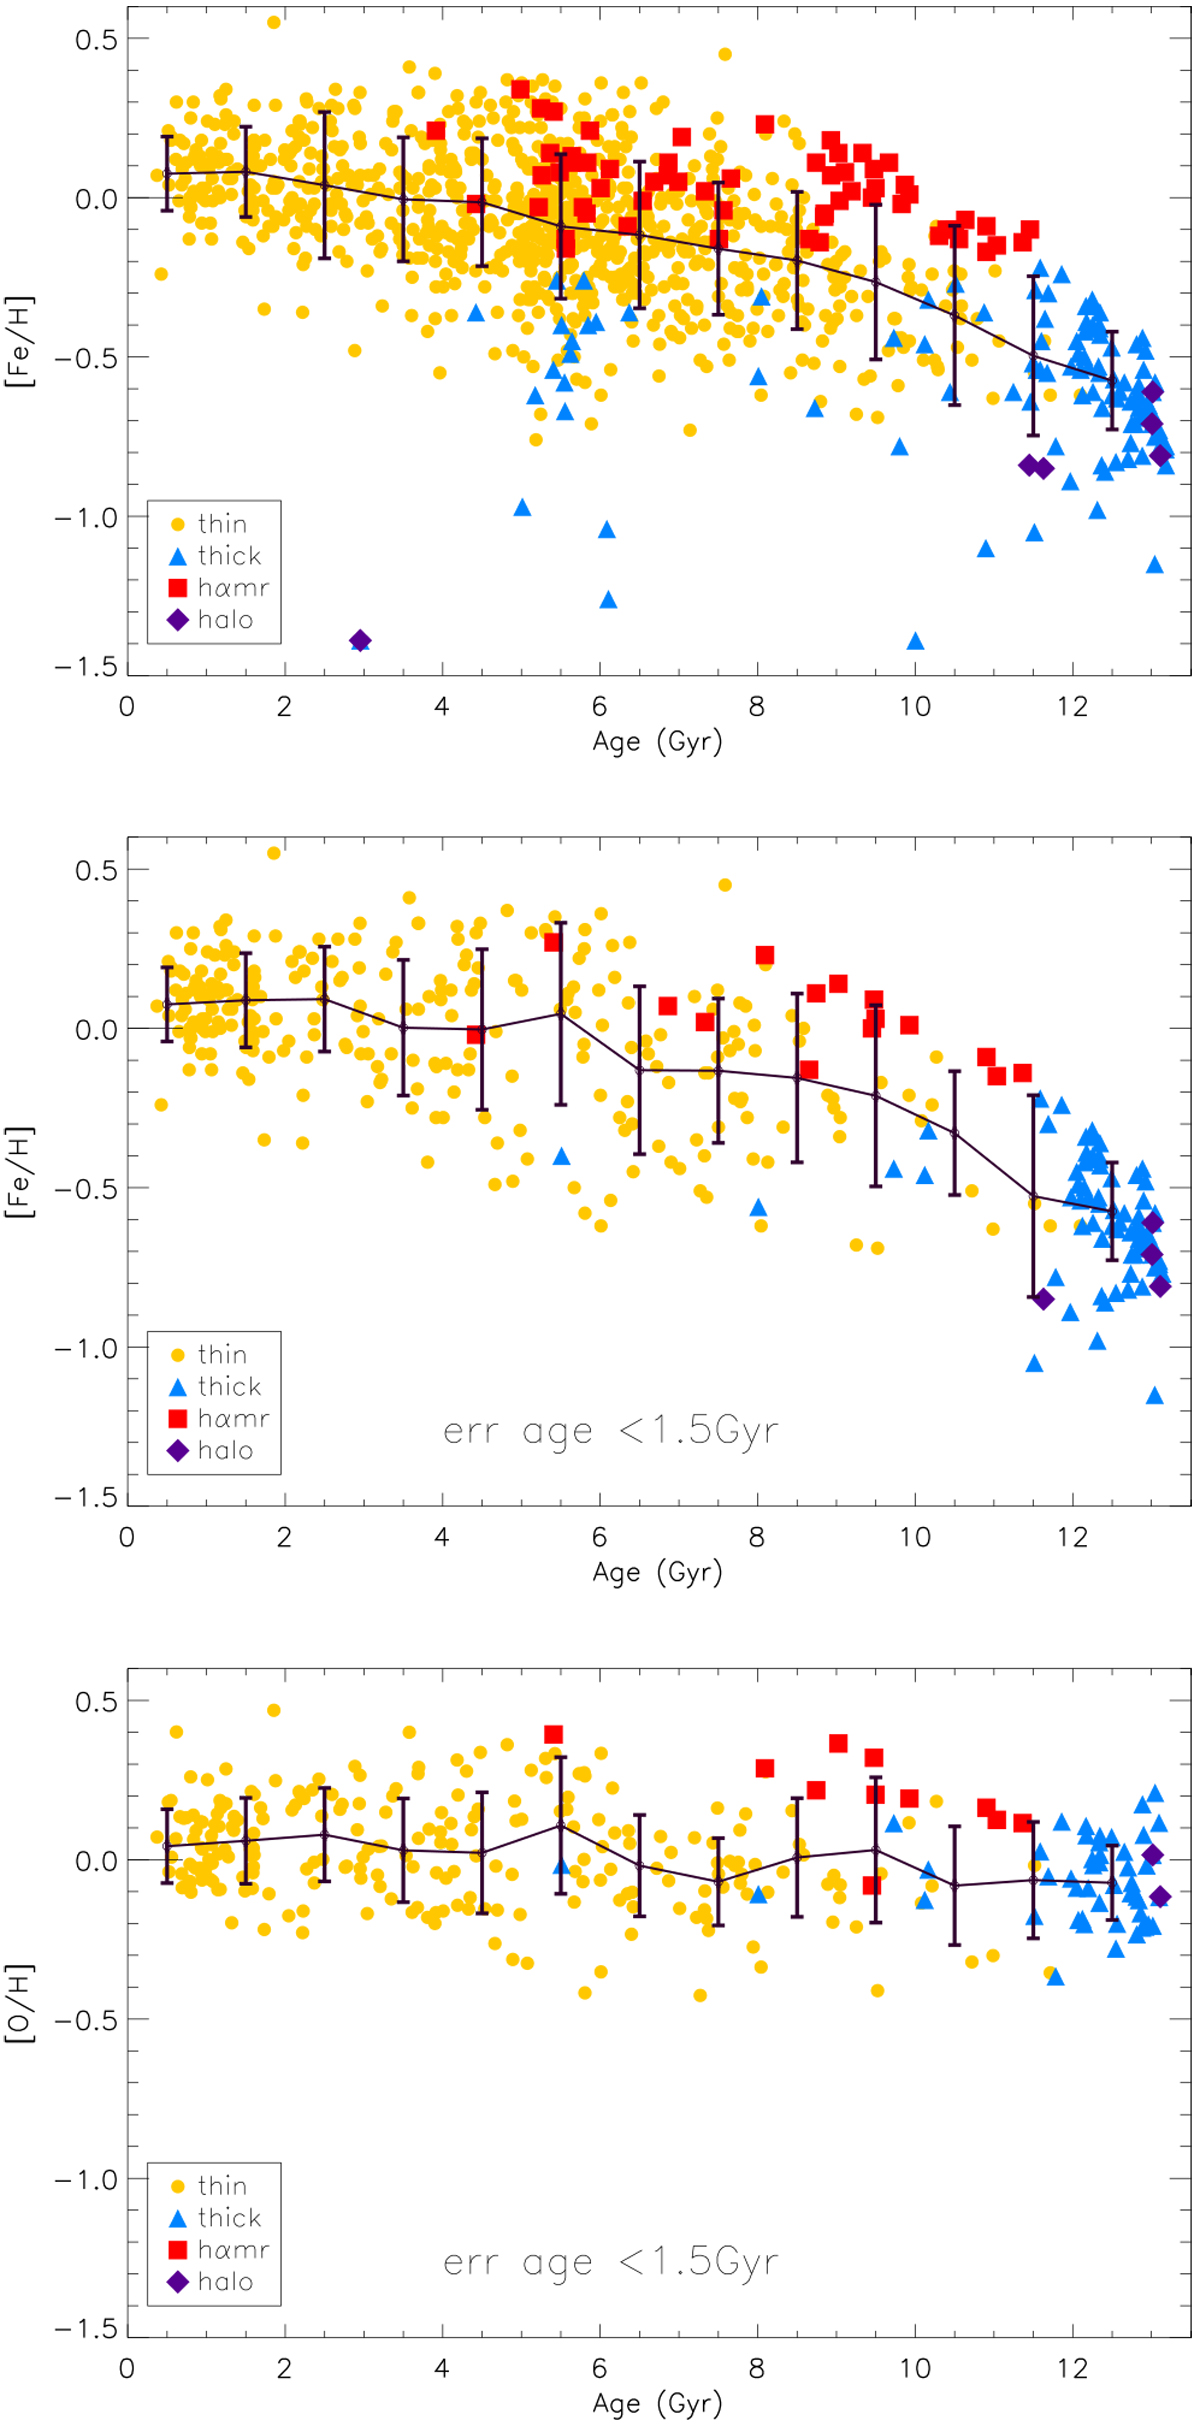
[Fe/H] as a function of ages from Gaia DR2 for the full sample (upper panel) and for the subsample of stars with errors in age lower than 1.5 Gyr. The different stellar populations are depicted with different colors and symbols as explained in the legend. The average and standard deviation of [Fe/H] in 1 Gyr size bins are shown with a black line and error bars.
Current usage metrics show cumulative count of Article Views (full-text article views including HTML views, PDF and ePub downloads, according to the available data) and Abstracts Views on Vision4Press platform.
Data correspond to usage on the plateform after 2015. The current usage metrics is available 48-96 hours after online publication and is updated daily on week days.
Initial download of the metrics may take a while.