Fig. 12
Download original image
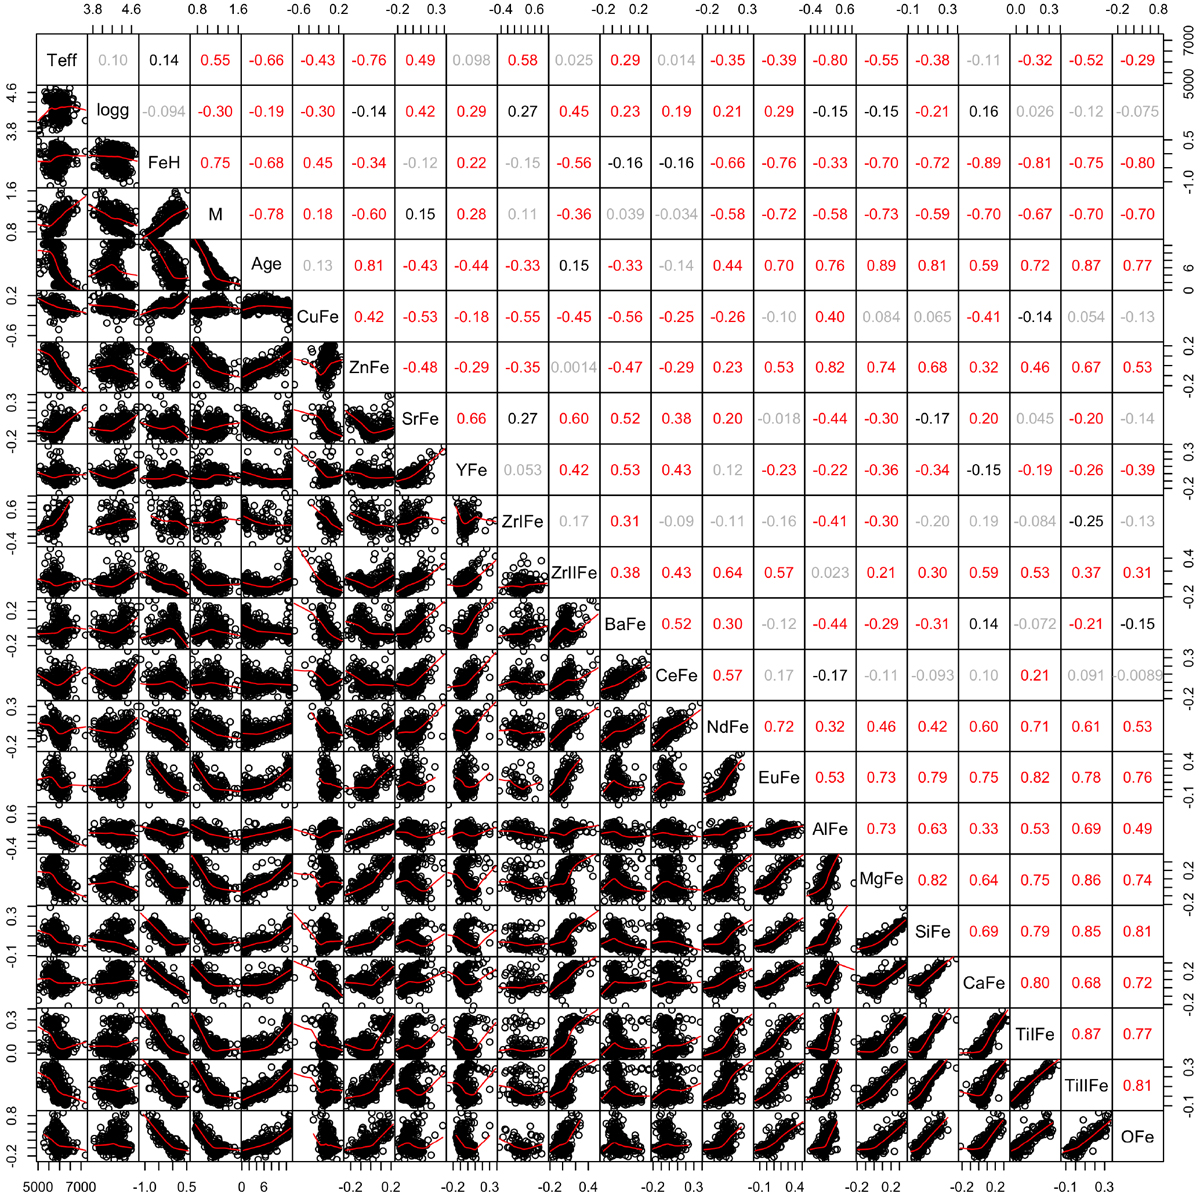
Correlations of all the variables with each other in the subset using the stars with the most accurate age determination (see text for details). In the upper triangular part, the Spearman statistic, ρ for each correlation is depicted. The color of the font represents the statistical significance of the correlations depending on the p-value, with red, black, and gray for values with p < 0.001, p < 0.01 and p < 0.1, respectively.In the lower triangular part we also show the spread-plot of each pair of variables, with LOESS fit just to guide the eye.
Current usage metrics show cumulative count of Article Views (full-text article views including HTML views, PDF and ePub downloads, according to the available data) and Abstracts Views on Vision4Press platform.
Data correspond to usage on the plateform after 2015. The current usage metrics is available 48-96 hours after online publication and is updated daily on week days.
Initial download of the metrics may take a while.