Free Access
Fig. 1
Download original image
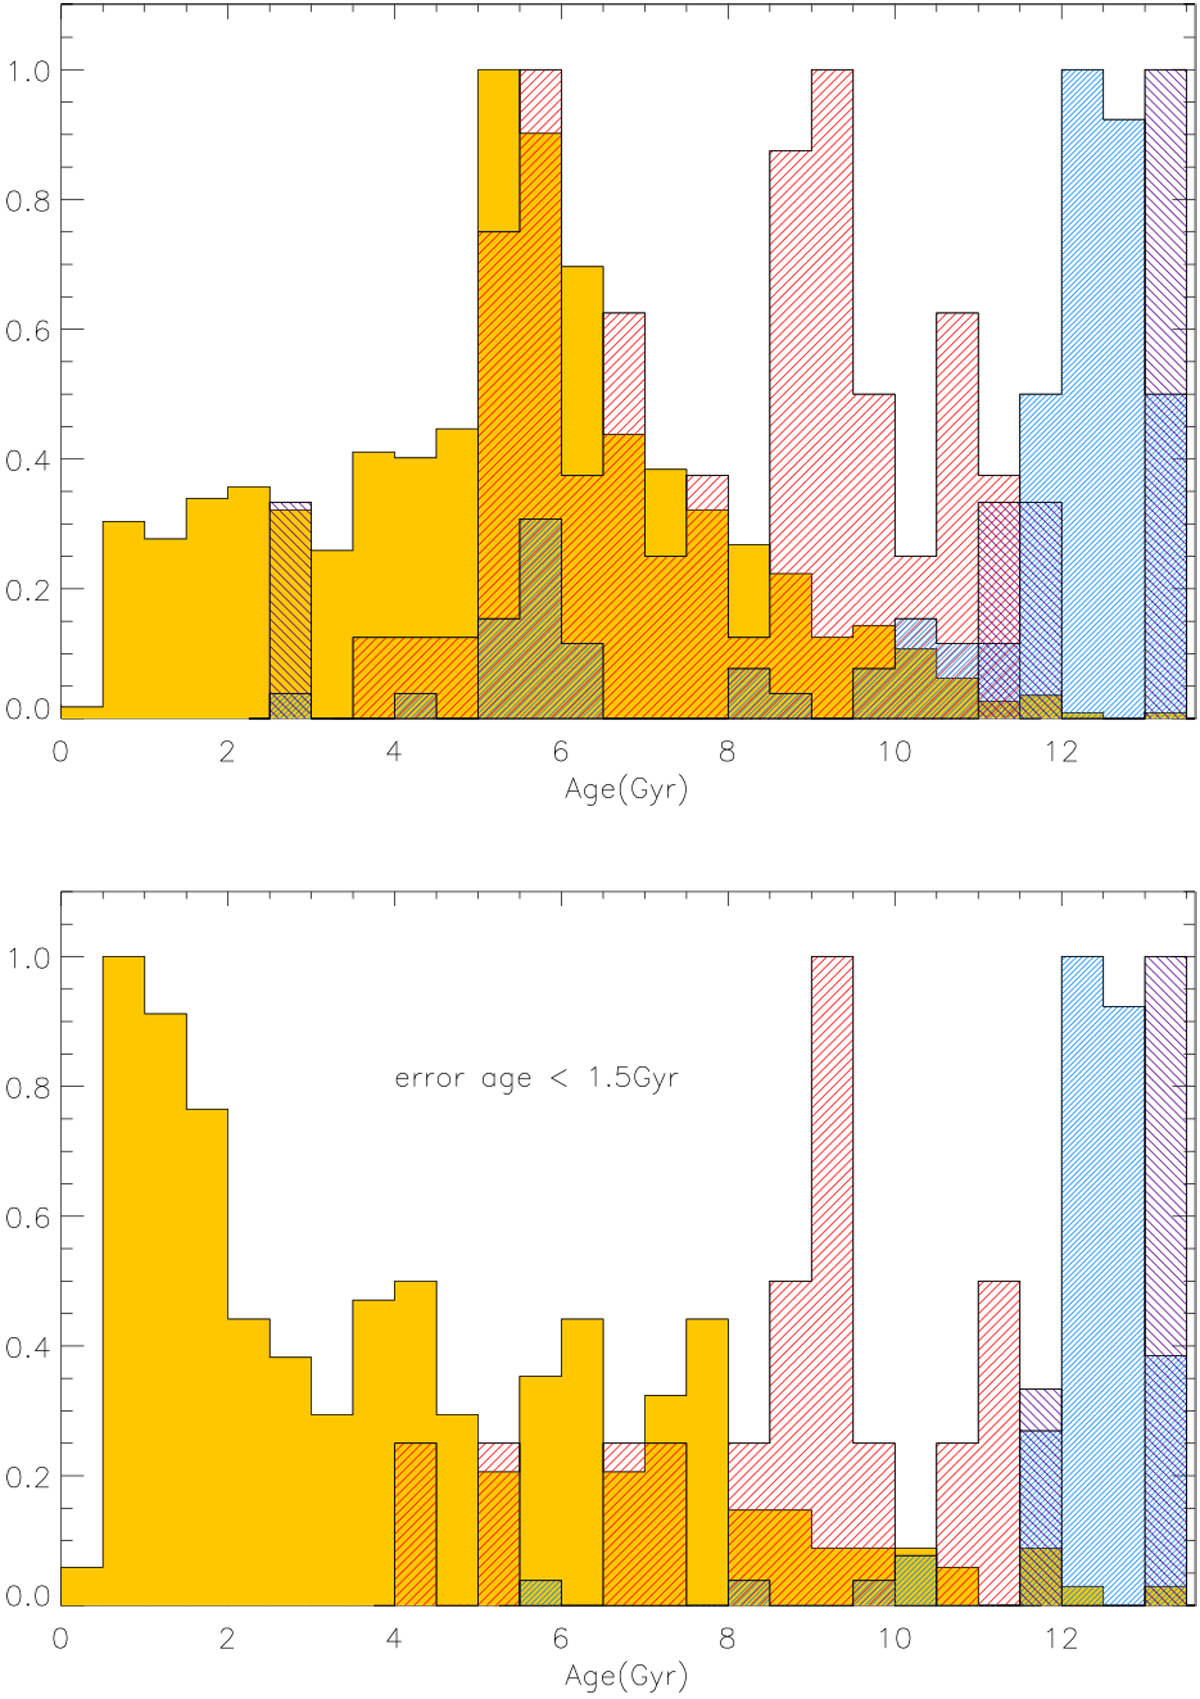
Normalized distribution (per stellar population) of ages for the full sample (upper panel) and a subset with small errors in age (lower panel) using Gaia DR2 parallaxes. The yellow, red, blue and purple histograms represent the thin, hαmr, thick and halo stars, respectively.
Current usage metrics show cumulative count of Article Views (full-text article views including HTML views, PDF and ePub downloads, according to the available data) and Abstracts Views on Vision4Press platform.
Data correspond to usage on the plateform after 2015. The current usage metrics is available 48-96 hours after online publication and is updated daily on week days.
Initial download of the metrics may take a while.