Fig. 4.
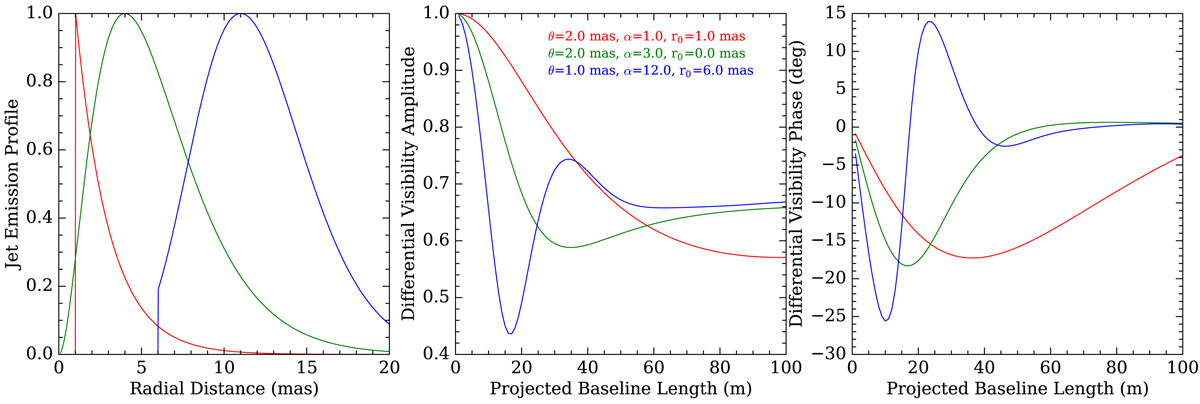
Example jet radial emission profiles (left) that can be created by the model, and corresponding differential visibility amplitudes and phases (middle, right) as a function of projected baseline length in the jet direction. The continuum is modeled as an unresolved point source, the flux ratio between the jet and the continuum is 0.5, and the wavelength is 2 μm. At the spatial scales probed by GRAVITY, more compact profiles (red) have smoother visibility curves, whereas more extended profiles (blue) show more significant substructure in the visibilities.
Current usage metrics show cumulative count of Article Views (full-text article views including HTML views, PDF and ePub downloads, according to the available data) and Abstracts Views on Vision4Press platform.
Data correspond to usage on the plateform after 2015. The current usage metrics is available 48-96 hours after online publication and is updated daily on week days.
Initial download of the metrics may take a while.