Fig. 3.
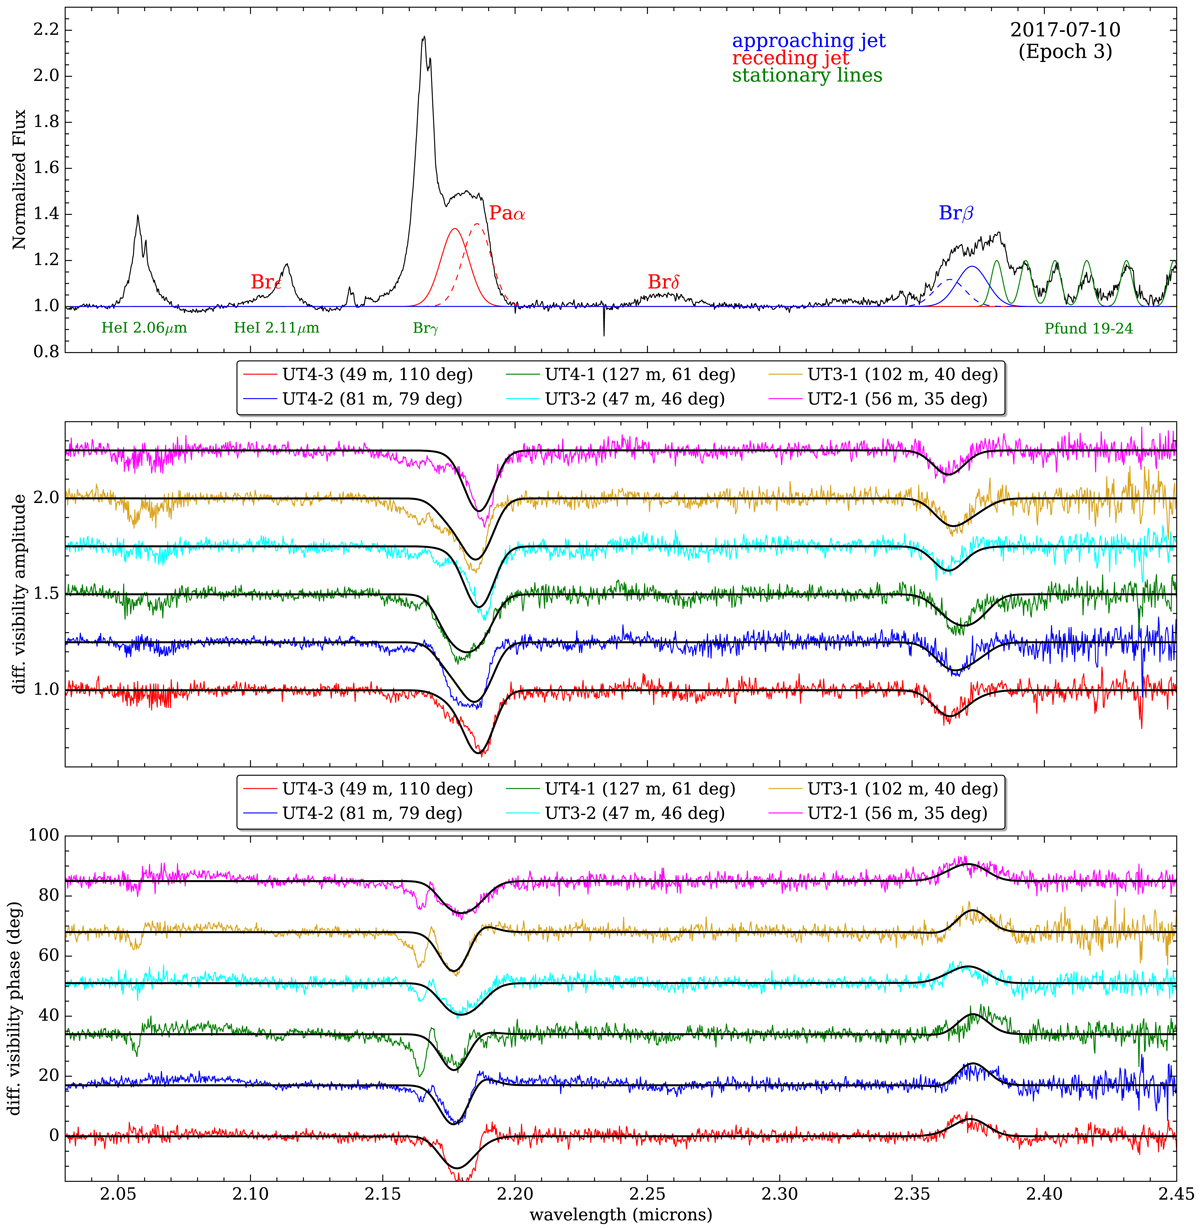
Data and best-fit jet model for the 2017 Epoch 3 GRAVITY observation. Compact (recent) and extended (older) jet knots are shown in the spectrum as full and dashed lines, respectively. Stationary lines are labeled in green. There is substantial blending of the Paα lines from the receding jet with the stationary Brγ line, which also has differential visibility signatures across it. The fits are done to all lines simultaneously, but we plot only the model for jet lines for clarity. The baseline projected lengths and position angles on sky are indicated in the labels.
Current usage metrics show cumulative count of Article Views (full-text article views including HTML views, PDF and ePub downloads, according to the available data) and Abstracts Views on Vision4Press platform.
Data correspond to usage on the plateform after 2015. The current usage metrics is available 48-96 hours after online publication and is updated daily on week days.
Initial download of the metrics may take a while.