Fig. 6.
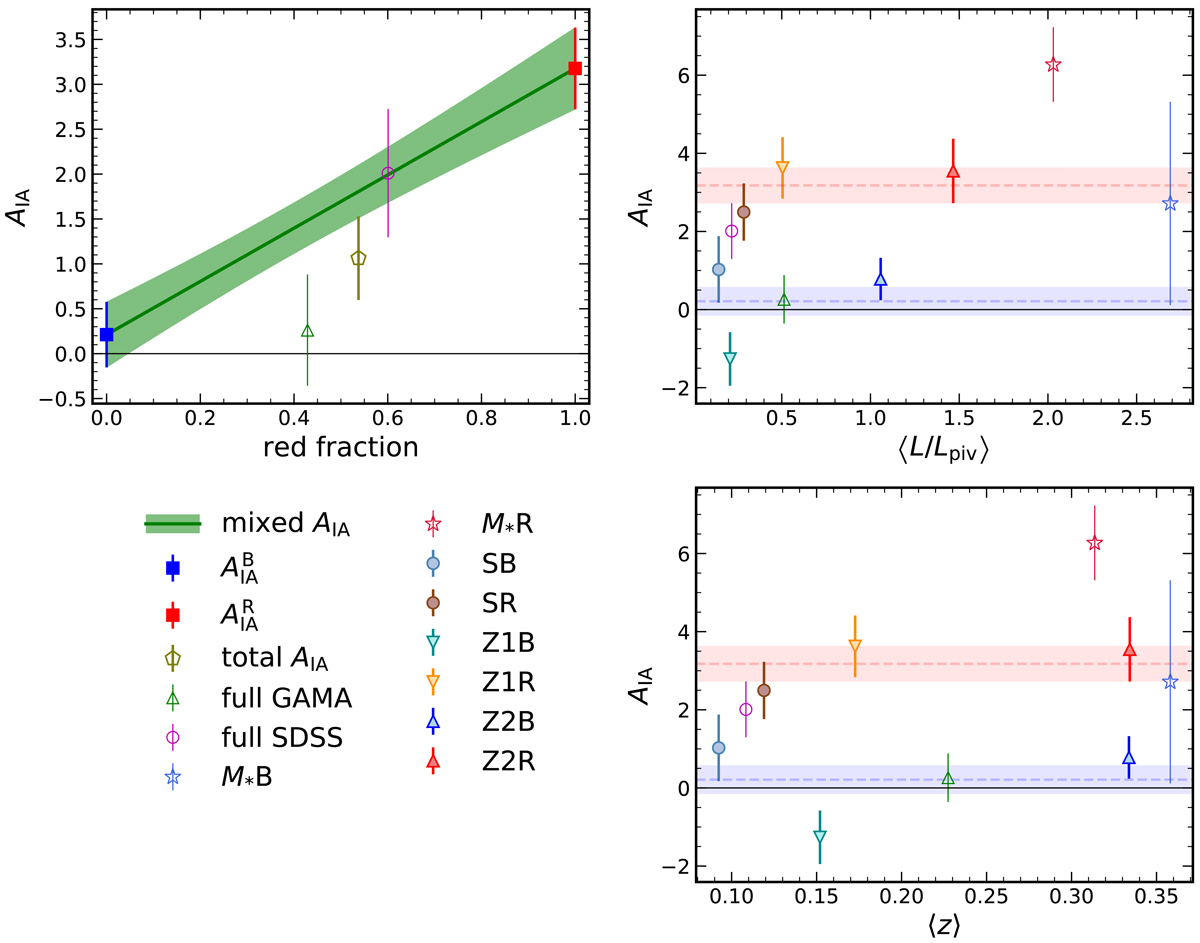
Constraints on the NLA model alignment amplitude AIA, from various subsamples of GAMA and SDSS (Table 1), plotted against sample properties. The constraints illustrated here are also given in Table B.1. Top left panel: AIA vs. shape sample red galaxy fraction. We interpolate (green line/shading) between our fits to blue (blue square) and red (red square) galaxy samples, according to ![]() , where fred is the red fraction and we assume linearity in the contributions of galaxy populations to the total alignment signal/amplitude. The inconsistency of mixed-sample signals (open points) with this interpolation is due to variable contributions of satellite galaxies – this is discussed in Sect. 4.2.2. Top right panel: AIA vs. shape sample luminosity (as a ratio to the pivot Lpiv ∼ 4.6 × 10¹⁰ L⊙, corresponding to absolute r-band magnitude Mr = −22). Bottom right panel: AIA vs. shape sample mean redshift. All plotted data points illustrate the mean and 68% confidence interval of 1D marginalised posterior distributions on AIA, after fitting to relevant alignment/clustering signals. Only the filled points are independent of each other; each of the open points is in some way correlated with the others. Dashed lines and shading indicate the mean and 68% CI of the total-colour fits, highlighting the type-dependence of alignments.
, where fred is the red fraction and we assume linearity in the contributions of galaxy populations to the total alignment signal/amplitude. The inconsistency of mixed-sample signals (open points) with this interpolation is due to variable contributions of satellite galaxies – this is discussed in Sect. 4.2.2. Top right panel: AIA vs. shape sample luminosity (as a ratio to the pivot Lpiv ∼ 4.6 × 10¹⁰ L⊙, corresponding to absolute r-band magnitude Mr = −22). Bottom right panel: AIA vs. shape sample mean redshift. All plotted data points illustrate the mean and 68% confidence interval of 1D marginalised posterior distributions on AIA, after fitting to relevant alignment/clustering signals. Only the filled points are independent of each other; each of the open points is in some way correlated with the others. Dashed lines and shading indicate the mean and 68% CI of the total-colour fits, highlighting the type-dependence of alignments.
Current usage metrics show cumulative count of Article Views (full-text article views including HTML views, PDF and ePub downloads, according to the available data) and Abstracts Views on Vision4Press platform.
Data correspond to usage on the plateform after 2015. The current usage metrics is available 48-96 hours after online publication and is updated daily on week days.
Initial download of the metrics may take a while.