Fig. A.4.
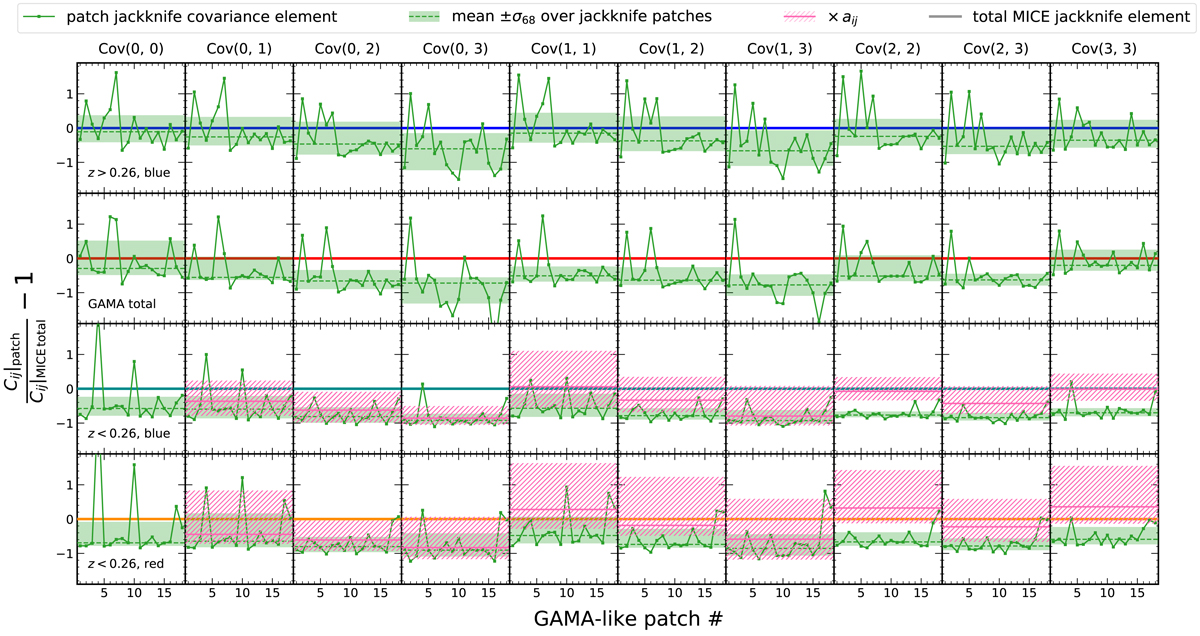
A comparison of clustering covariance elements (columns), estimated for each redshift/colour galaxy sample (rows) with the SWOT internal jackknife per MICE patch (X, green) and the total jackknife over all patches (Y, solid coloured lines), plotted as X/Y − 1. The 0.16 , 0.5 , 0.84 percentiles over the patch estimates are indicated by dashed lines and shading. Pink solid lines and hatching indicate covariance elements scaled by the fitted variables aij described in Appendix A.2.
Current usage metrics show cumulative count of Article Views (full-text article views including HTML views, PDF and ePub downloads, according to the available data) and Abstracts Views on Vision4Press platform.
Data correspond to usage on the plateform after 2015. The current usage metrics is available 48-96 hours after online publication and is updated daily on week days.
Initial download of the metrics may take a while.