Fig. A.3.
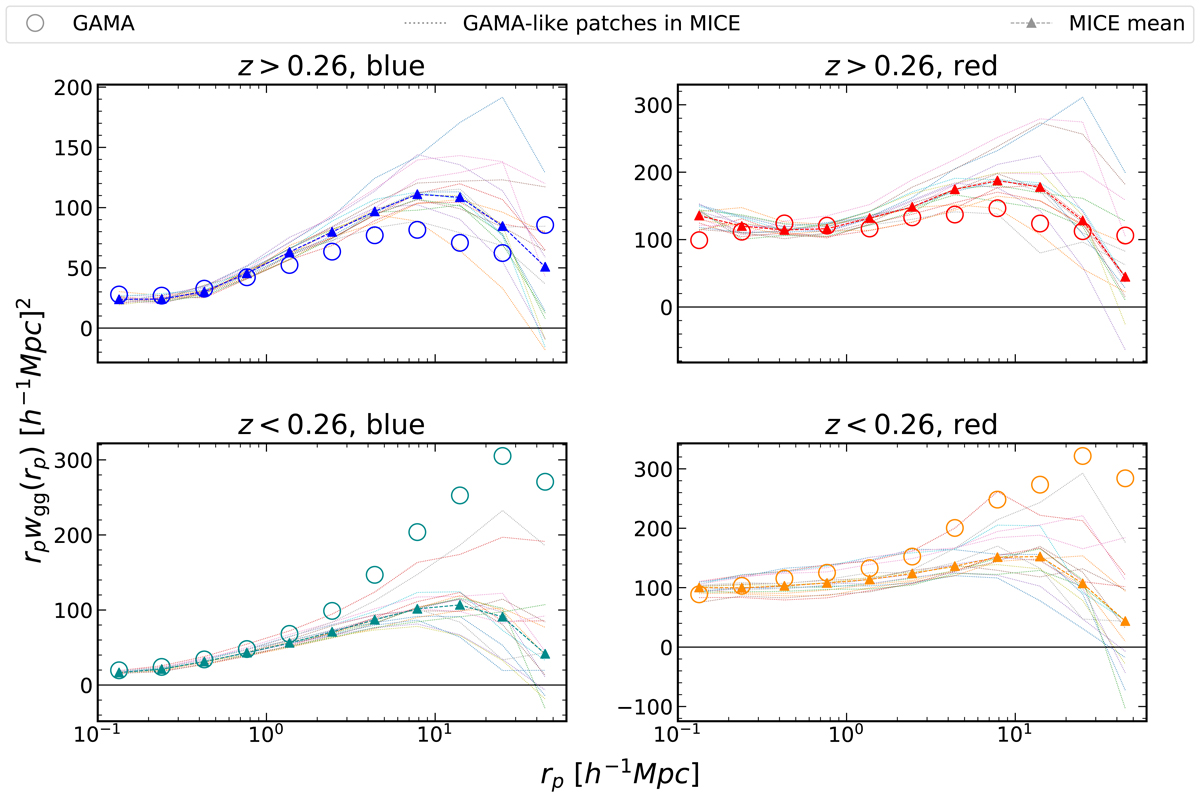
Clustering measurements from our defined GAMA galaxy samples (open circles) overlaid with corresponding measurements from individual, ∼180 deg2 MICE subvolumes (dotted lines). Filled triangles show the means of the MICE clustering signals. We see significant differences between MICE and GAMA, particularly at low redshift and large scales, and so choose not to estimate covariances directly from MICE – see Appendix A.2 for details.
Current usage metrics show cumulative count of Article Views (full-text article views including HTML views, PDF and ePub downloads, according to the available data) and Abstracts Views on Vision4Press platform.
Data correspond to usage on the plateform after 2015. The current usage metrics is available 48-96 hours after online publication and is updated daily on week days.
Initial download of the metrics may take a while.