Fig. A.2.
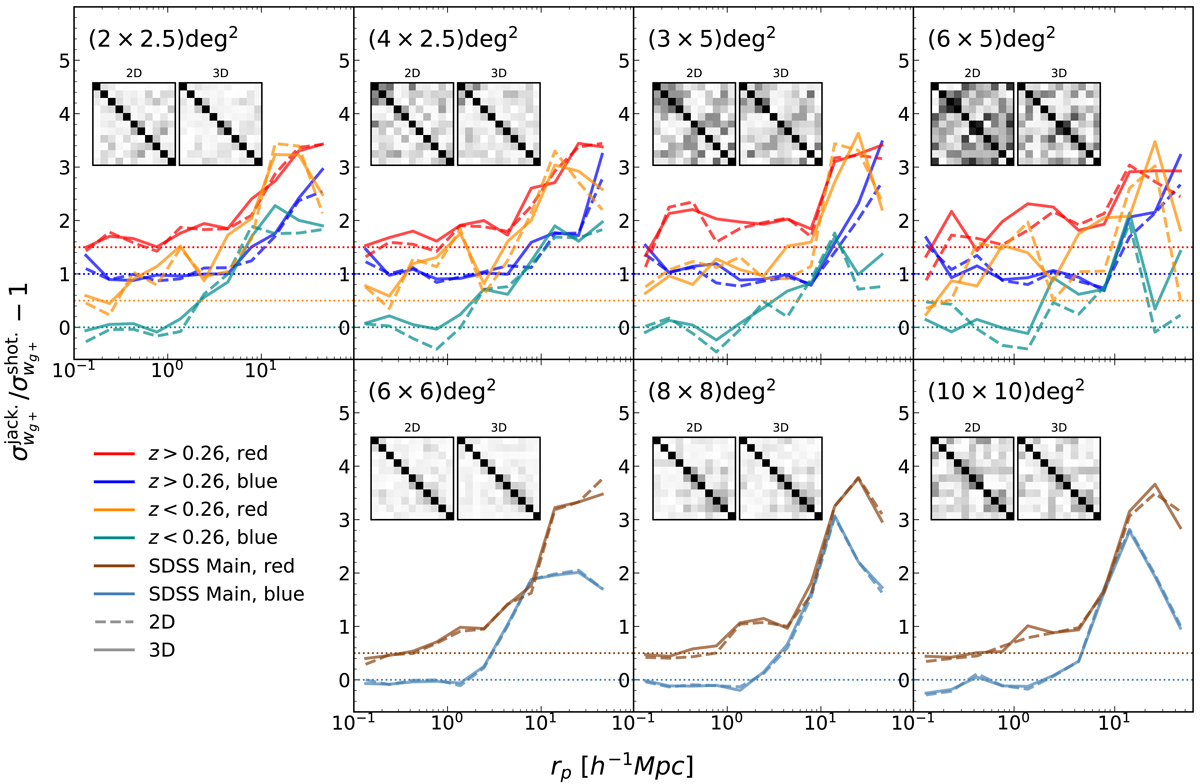
Performance of the 3D (solid lines) and 2D (dashed lines) jackknife in various configurations, plotted as ratios to analytical (shot-noise) errors estimated for the wg+ statistic. GAMA configurations are plotted on the top row, with SDSS on the bottom. Colour/redshift sample error ratios are vertically offset by increments of 0.5 (equivalent to a 50% difference in the error on wg+ ) for clarity, and σjack./σshot. = 1 is indicated for each sample by a dotted horizontal line. Also shown are the Z2R and SR samples’ 2D (left-in-panel) and 3D (right-in-panel) jackknife estimates of absolute correlation matrices ![]() , for covariance Cij, with i , j ∈ [ 1 , 11 ] for 11 bins in rp. The angular dimensions (RA × Dec) of jackknife patches, in degrees, are indicated. Clearly visible trends are increasingly noisy covariances from larger/fewer patches, and the tendency of the 3D jackknife to smooth this noise. The jackknife configurations we employ in our likelihood analysis are (3 × 5) deg2 and (10 × 10) deg2 for GAMA and SDSS, respectively.
, for covariance Cij, with i , j ∈ [ 1 , 11 ] for 11 bins in rp. The angular dimensions (RA × Dec) of jackknife patches, in degrees, are indicated. Clearly visible trends are increasingly noisy covariances from larger/fewer patches, and the tendency of the 3D jackknife to smooth this noise. The jackknife configurations we employ in our likelihood analysis are (3 × 5) deg2 and (10 × 10) deg2 for GAMA and SDSS, respectively.
Current usage metrics show cumulative count of Article Views (full-text article views including HTML views, PDF and ePub downloads, according to the available data) and Abstracts Views on Vision4Press platform.
Data correspond to usage on the plateform after 2015. The current usage metrics is available 48-96 hours after online publication and is updated daily on week days.
Initial download of the metrics may take a while.