Fig. A.1.
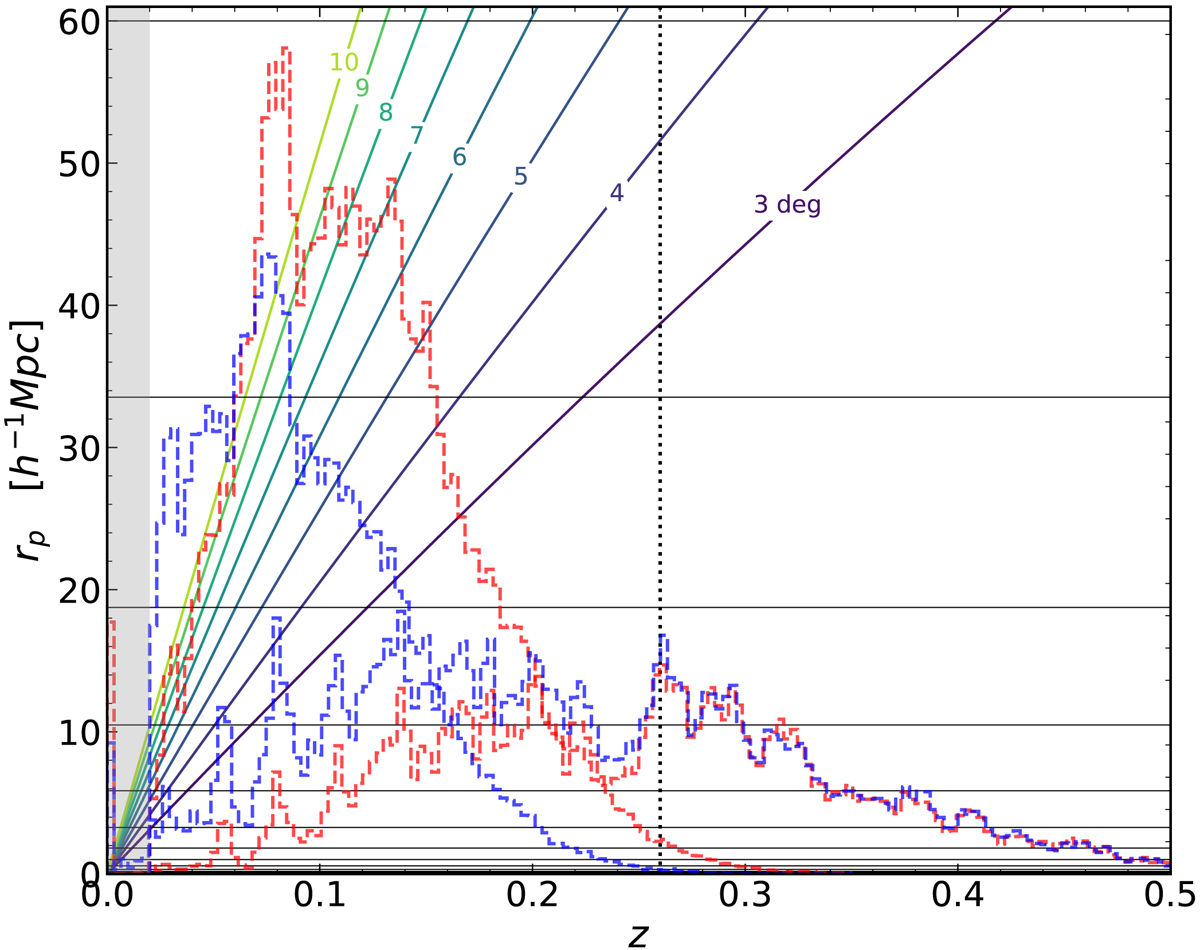
As a function of redshift, the comoving transverse vs. on-sky angular scale relation, for a range of scales in degrees. The rp bin edges we employ are plotted as horizontal black lines, highlighting the limitations of too-small patches to sample larger rp pairs, esp. at lower redshifts. The vertical dotted line indicates the z = 0.26 redshift division for our GAMA samples, and redshift distributions of red and blue galaxies in SDSS (z ∼ [ 0.02 , 0.3 ]) and GAMA (z ∼ [ 0.02 , 0.5 ]) are overlaid as coloured, dashed histograms. Grey shading indicates z < 0.02, which we exclude from our analysis.
Current usage metrics show cumulative count of Article Views (full-text article views including HTML views, PDF and ePub downloads, according to the available data) and Abstracts Views on Vision4Press platform.
Data correspond to usage on the plateform after 2015. The current usage metrics is available 48-96 hours after online publication and is updated daily on week days.
Initial download of the metrics may take a while.