Fig. 1.
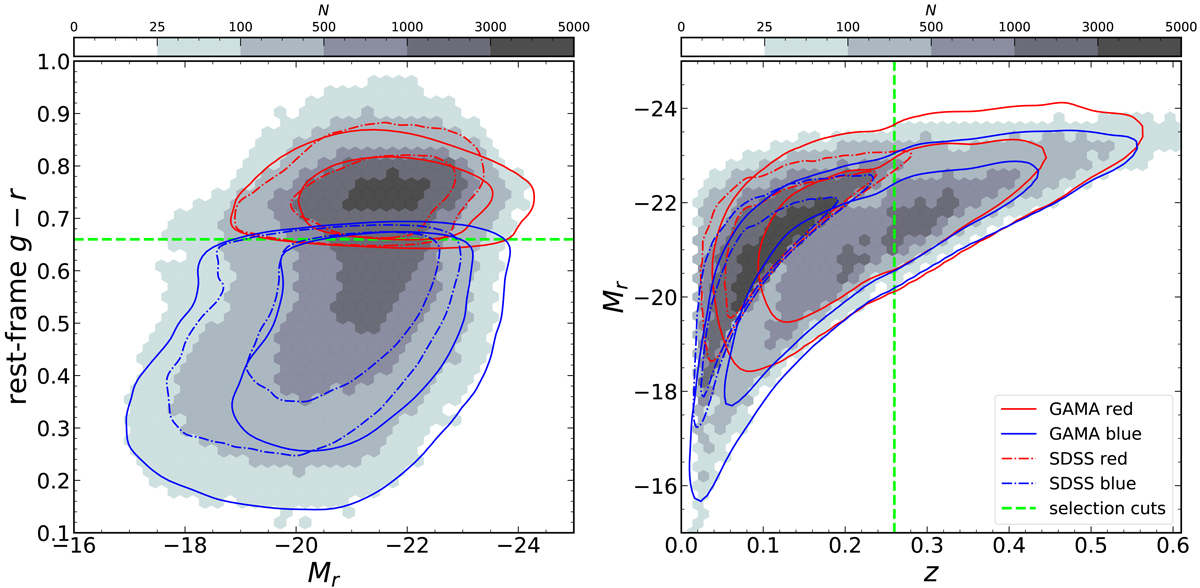
Left panel: galaxy rest-frame colour–magnitude diagram, where we choose a cut in g − r to isolate the red sequence in GAMA and SDSS. Right panel: sample absolute r-band magnitude-redshift diagram. The total distribution of GAMA and SDSS galaxies is shown, binned in hexagonal cells with a colour scale corresponding to the counts in cells. Coloured contours indicate 75% and 95% of galaxies in a sample. Colour/redshift cuts are shown as dashed green lines, and the apparent leakage of contours is due to the grid-size used in kernel density estimation.
Current usage metrics show cumulative count of Article Views (full-text article views including HTML views, PDF and ePub downloads, according to the available data) and Abstracts Views on Vision4Press platform.
Data correspond to usage on the plateform after 2015. The current usage metrics is available 48-96 hours after online publication and is updated daily on week days.
Initial download of the metrics may take a while.