Open Access
Fig. A.1.
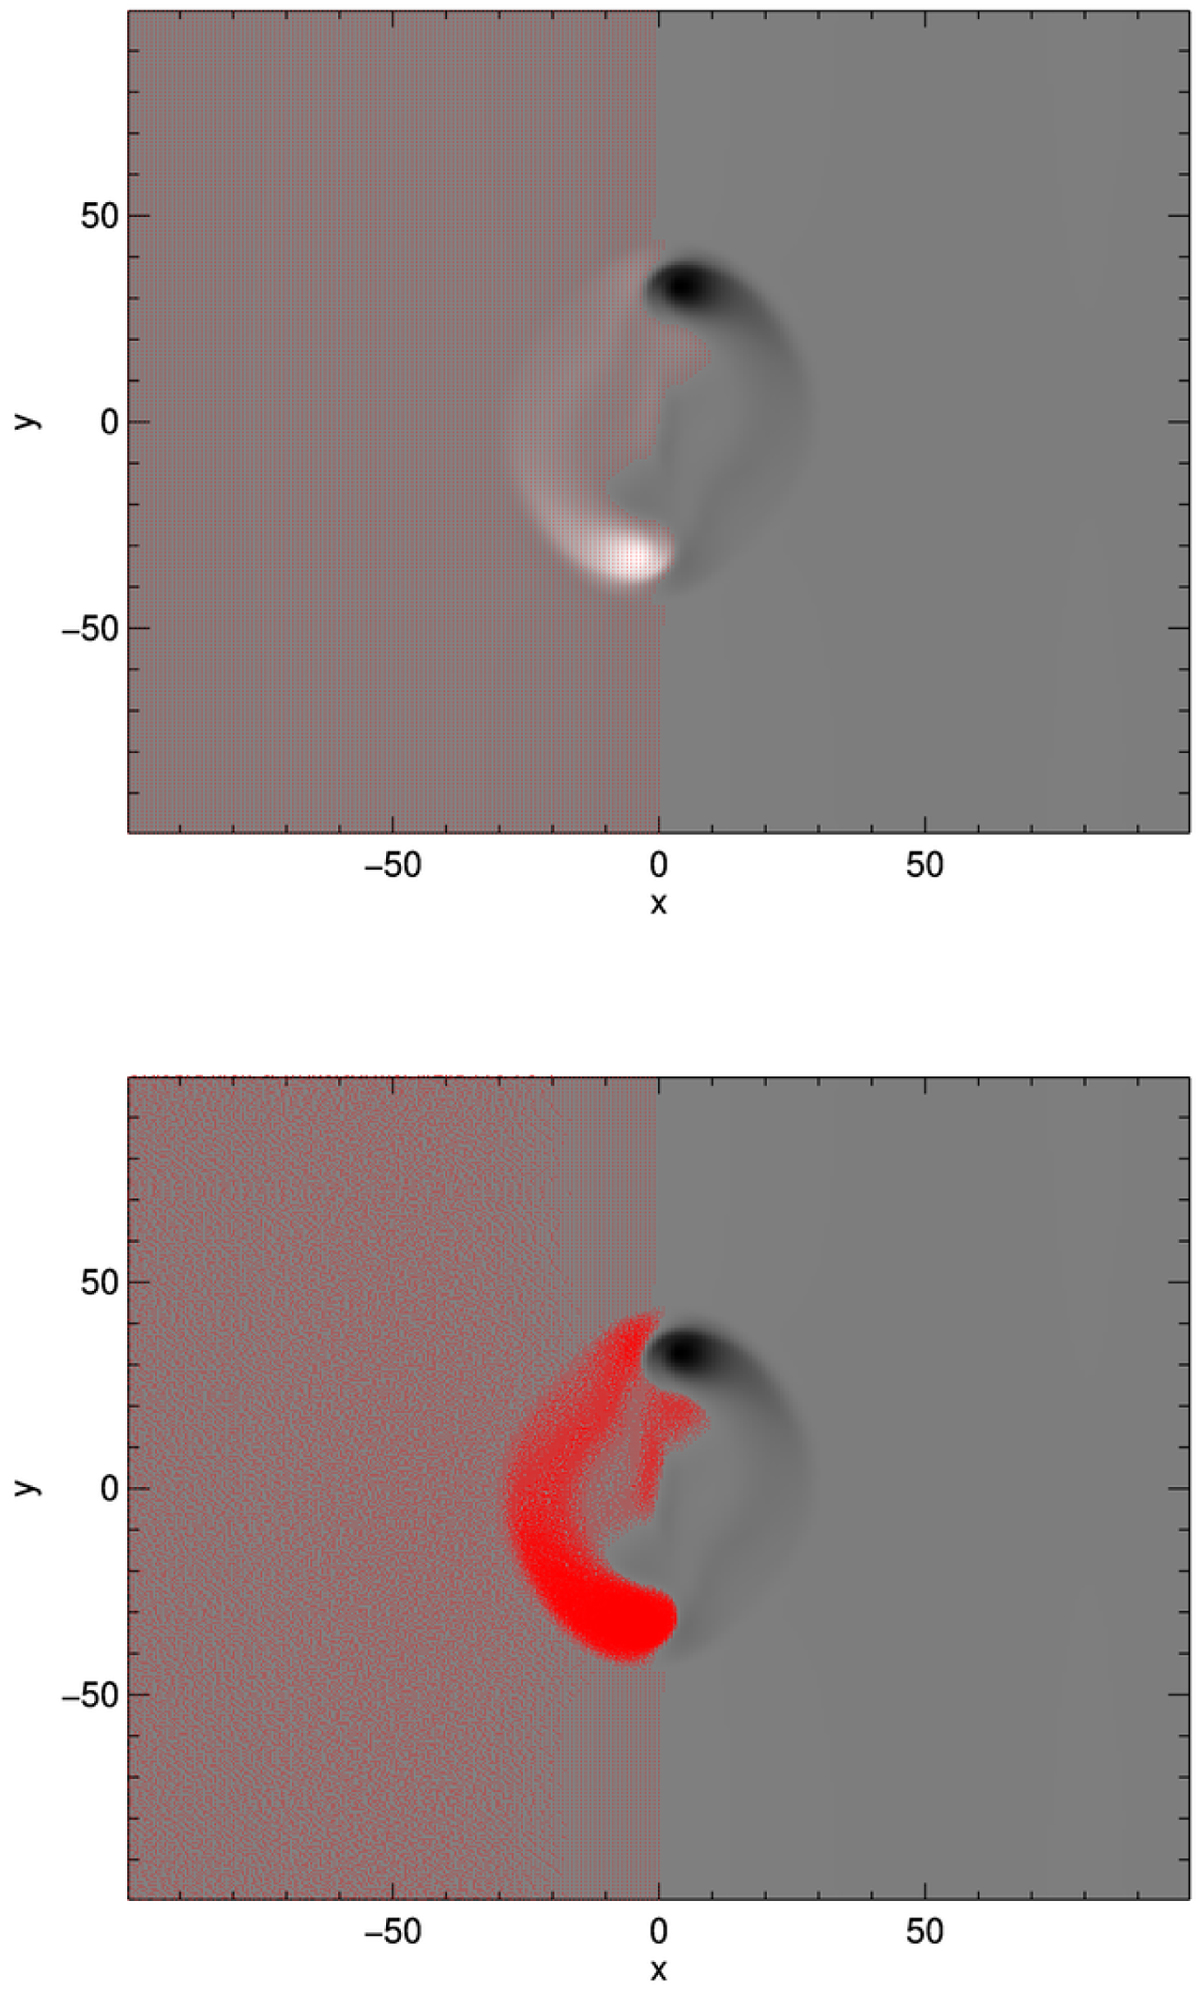
Footpoint locations for the positive polarity of the snapshot at t = 120 of the non-eruptive emergence simulation, as selected by the grid-point (top), and the flux-based (bottom) methods. Each footpoint is marked with a red dot, and they are overplotted on the Bz photospheric map.
Current usage metrics show cumulative count of Article Views (full-text article views including HTML views, PDF and ePub downloads, according to the available data) and Abstracts Views on Vision4Press platform.
Data correspond to usage on the plateform after 2015. The current usage metrics is available 48-96 hours after online publication and is updated daily on week days.
Initial download of the metrics may take a while.