Fig. 4.
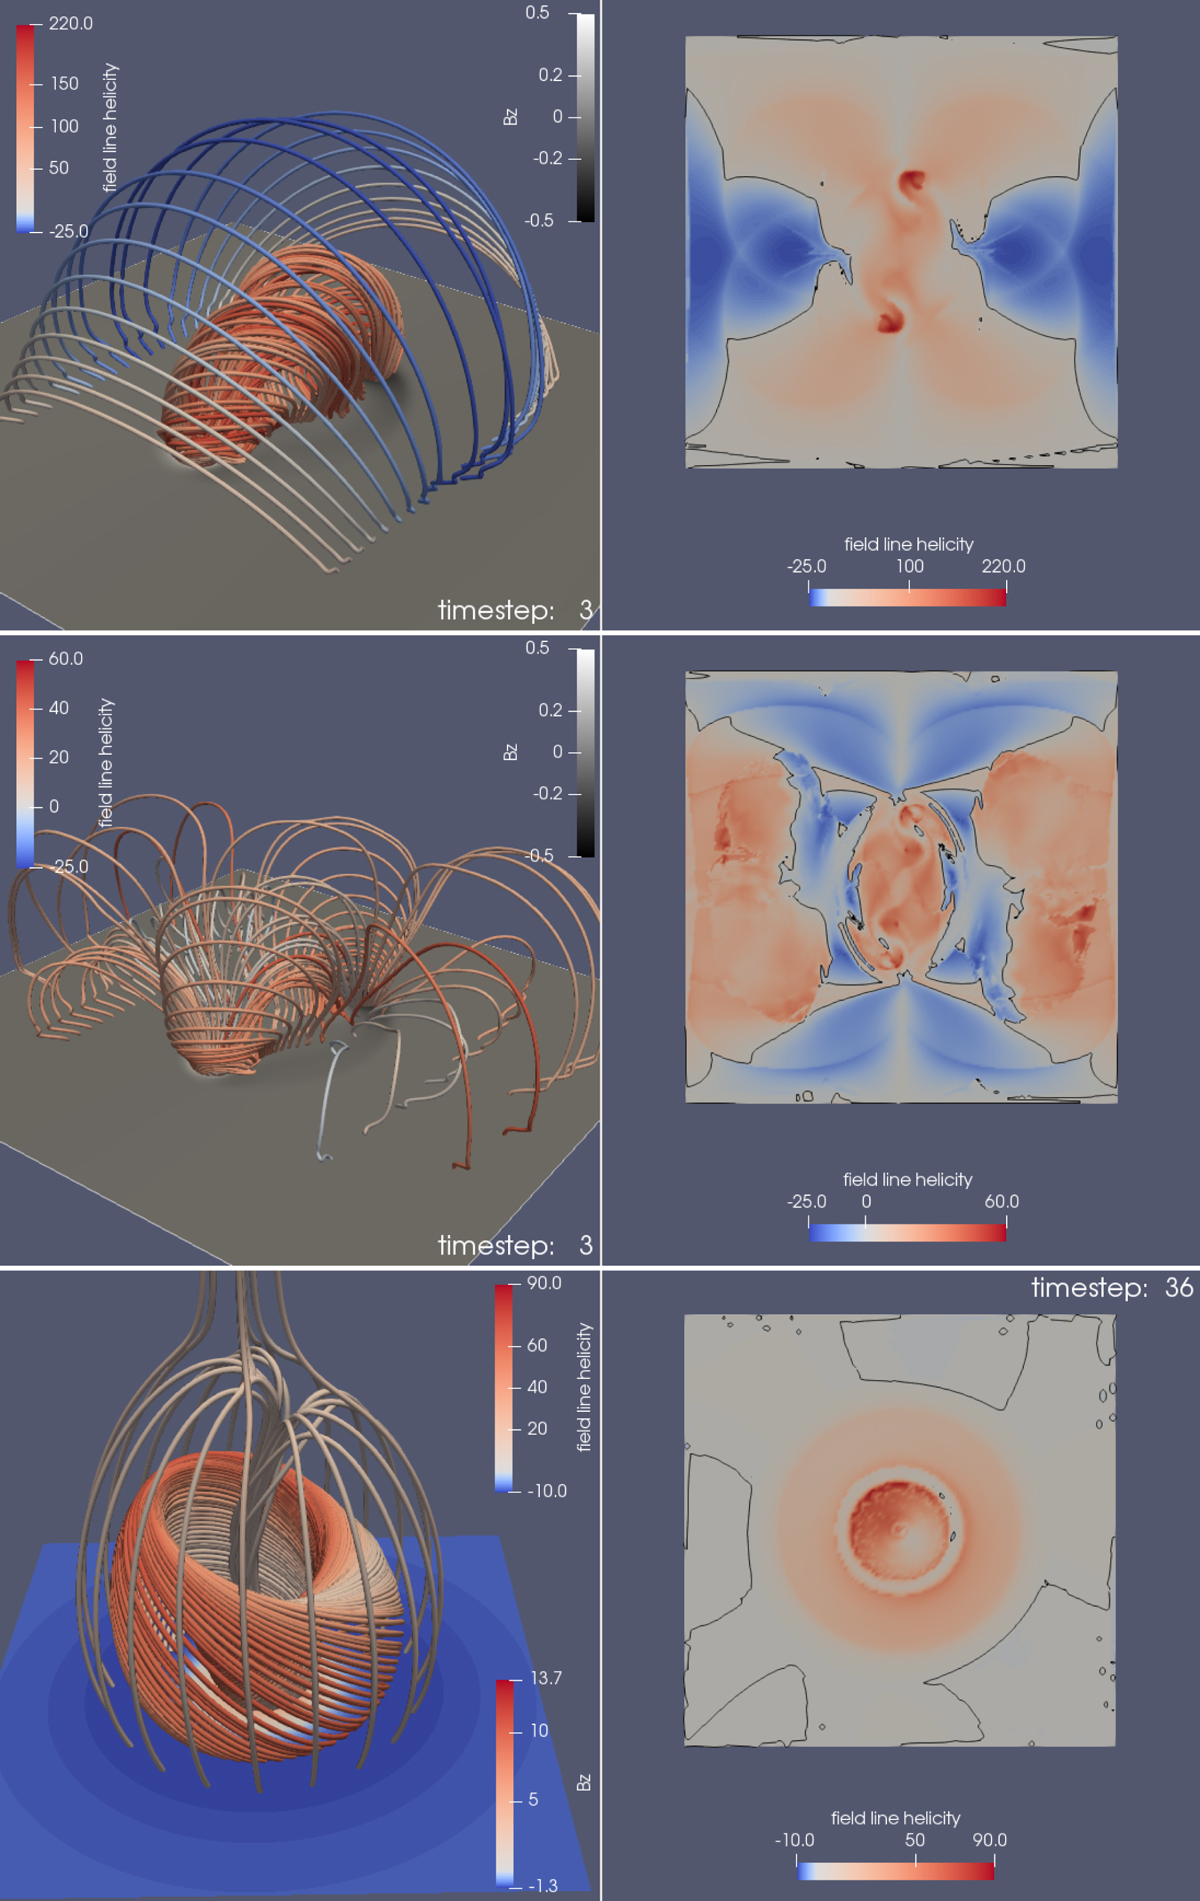
Field line helicity morphology for the snapshot at t = 120 of the non-eruptive emergence simulation (top panel), the snapshot at t = 110 of the eruptive emergence simulation (middle panel), and the snapshot at t = 920 of the jet formation simulation (bottom panel). The left plots show representative field lines coloured by the value of their RMFLH overplotted on the photospheric map of Bz. In the top two plots, field lines are drawn from the contours Bz = ±0.3 and the lines at x = ±50, while in the bottom plot from the contour Bz = 5 and the circle of radius r = 3.4 centred on the image. The right plots show the respective 2D maps of RMFLH on the photospheric plane.
Current usage metrics show cumulative count of Article Views (full-text article views including HTML views, PDF and ePub downloads, according to the available data) and Abstracts Views on Vision4Press platform.
Data correspond to usage on the plateform after 2015. The current usage metrics is available 48-96 hours after online publication and is updated daily on week days.
Initial download of the metrics may take a while.