Fig. 8.
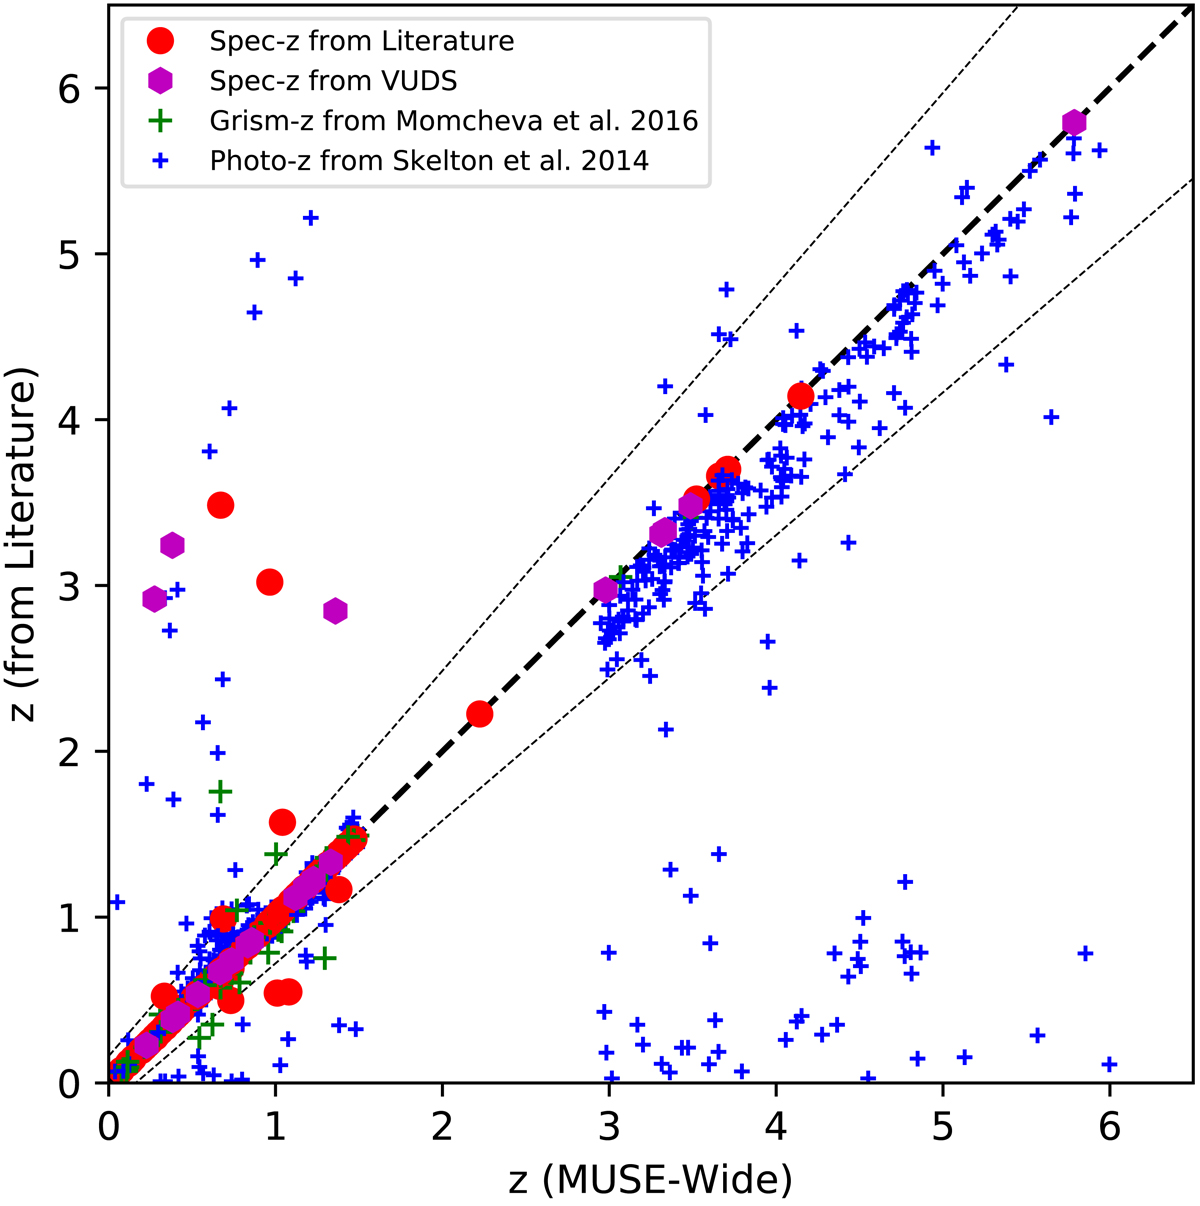
Redshift comparison between MUSE and literature redshifts for our emission line selected galaxies. Red dots denote the compilation of redshifts from the literature gathered in Skelton et al. (2014). Magenta hexagons represent spectroscopic measurements from VUDS (Tasca et al. 2017). Green crosses represent grism spectroscopic redshifts from Momcheva et al. (2016), which were aided by the photometric redshifts from Skelton et al. (2014) denoted with blue crosses. The thin dashed lines show the regions outside of which a photometric redshift is determined as a catastrophic failure.
Current usage metrics show cumulative count of Article Views (full-text article views including HTML views, PDF and ePub downloads, according to the available data) and Abstracts Views on Vision4Press platform.
Data correspond to usage on the plateform after 2015. The current usage metrics is available 48-96 hours after online publication and is updated daily on week days.
Initial download of the metrics may take a while.