Fig. 7.
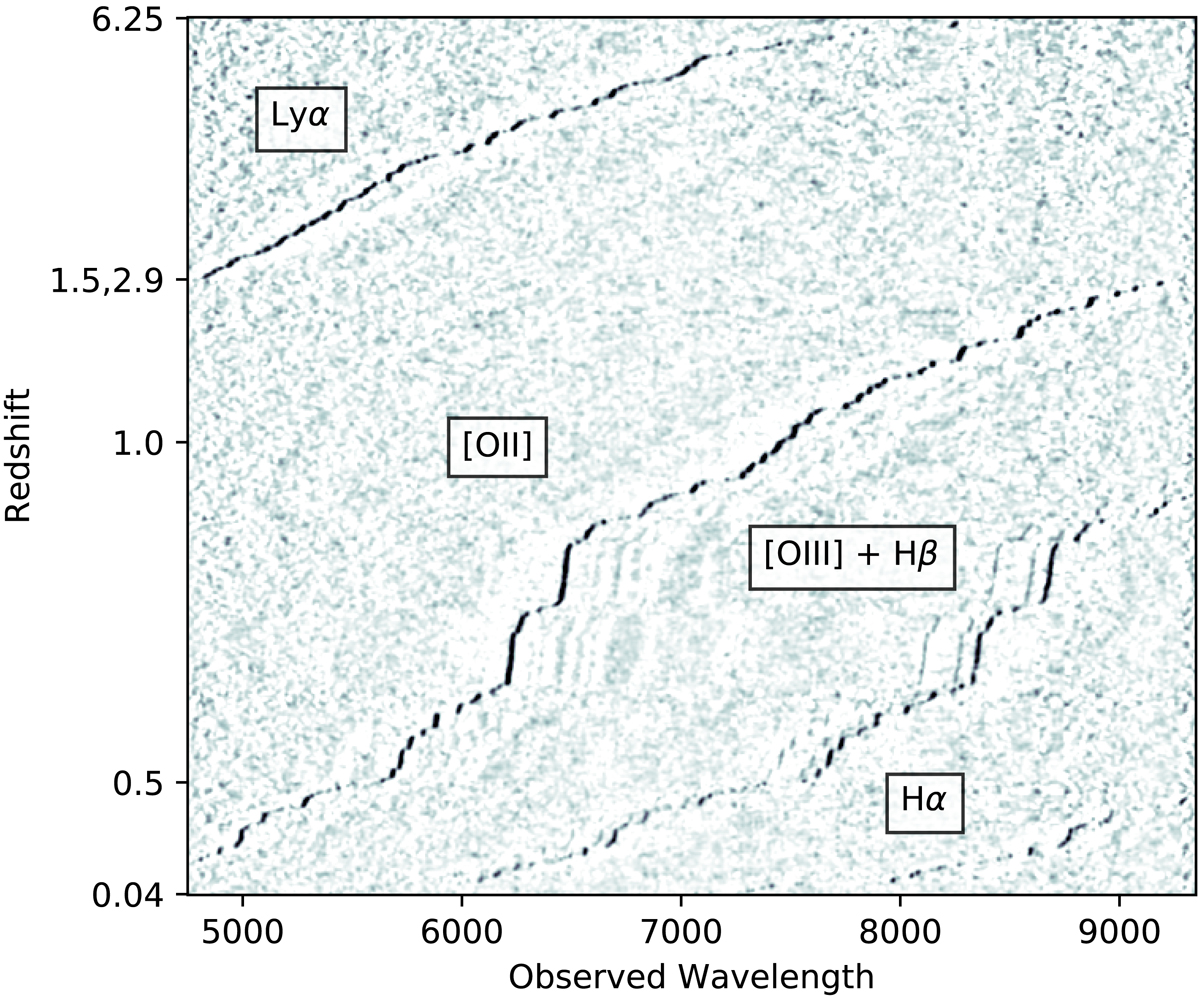
Stack of normalized spectra of the emission line objects. They are stacked in y-direction with increasing redshifts, with a large jump between z∼1.5 and z∼2.9. First we normalized the spectra to the brightest emission line, then we smoothed with a 10 Å Gaussian and finally we smoothed the 2D image with a 2.8 pixel 2D circular Gaussian.
Current usage metrics show cumulative count of Article Views (full-text article views including HTML views, PDF and ePub downloads, according to the available data) and Abstracts Views on Vision4Press platform.
Data correspond to usage on the plateform after 2015. The current usage metrics is available 48-96 hours after online publication and is updated daily on week days.
Initial download of the metrics may take a while.