Fig. 6.
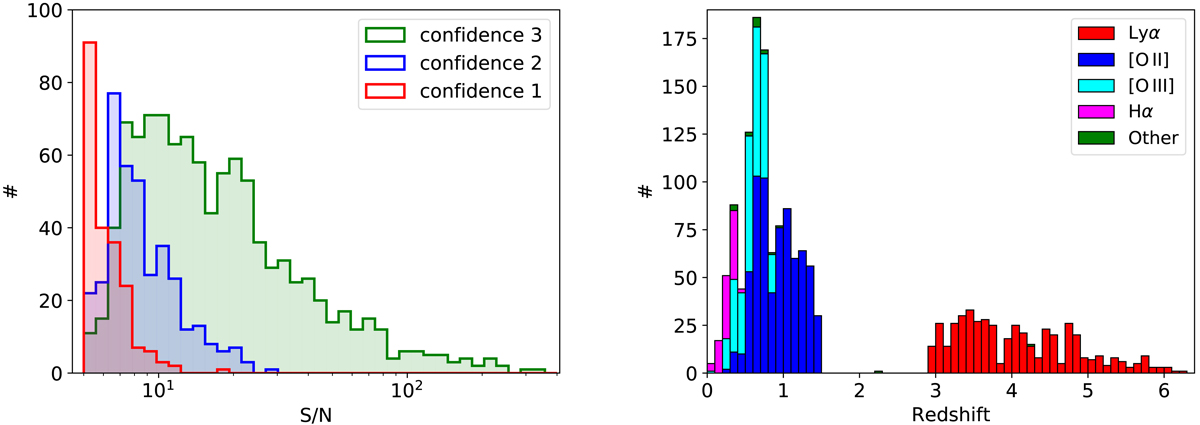
Left: distribution of number of emission-line objects as a function of S/N of the lead line for each of the three confidence levels we employ for classification. Objects at the S/N limit are dominated by confidence 1 objects and may include some spurious lines, while for objects with S/N above 10, we expect hardly any misclassifications. Right: redshift histogram of the emission line sources classified by their strongest line. The redshift desert, where there are no strong emission lines in the MUSE wavelength range between 1.5 < z < 2.9, is clearly visible. We are able to find 479 LAEs, reaching densities of almost 12 LAEs/arcmin2.
Current usage metrics show cumulative count of Article Views (full-text article views including HTML views, PDF and ePub downloads, according to the available data) and Abstracts Views on Vision4Press platform.
Data correspond to usage on the plateform after 2015. The current usage metrics is available 48-96 hours after online publication and is updated daily on week days.
Initial download of the metrics may take a while.