Fig. 3.
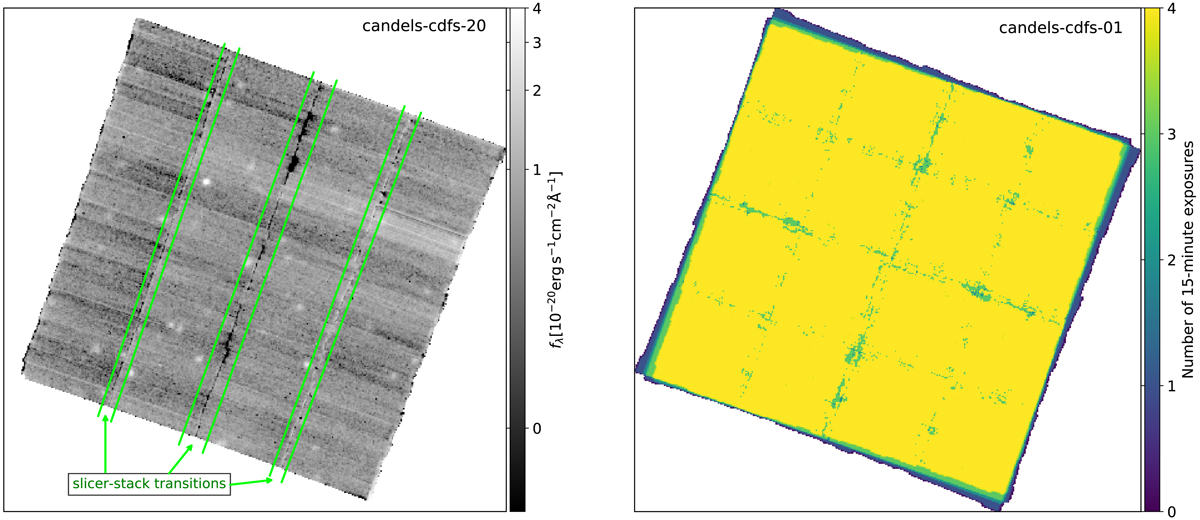
Left: whitelight image of a single 15 minute exposure of a cube with only a few bright galaxies in the field (candels-cdfs-20), so that the contrast is enhanced. The dark regions in the slicer stack transitions immediately become visible. The regions in which the lowest 2% voxels are masked are marked by the green straight lines. Right: example of a collapsed, combined 4 × 900s exposure cube (candels-cdfs-01) showing the different exposure times at the edges due to the trapezoidal shape of the MUSE field of view. The square pattern shows the regions masked in the slicer stack transitions.
Current usage metrics show cumulative count of Article Views (full-text article views including HTML views, PDF and ePub downloads, according to the available data) and Abstracts Views on Vision4Press platform.
Data correspond to usage on the plateform after 2015. The current usage metrics is available 48-96 hours after online publication and is updated daily on week days.
Initial download of the metrics may take a while.