Fig. 11.
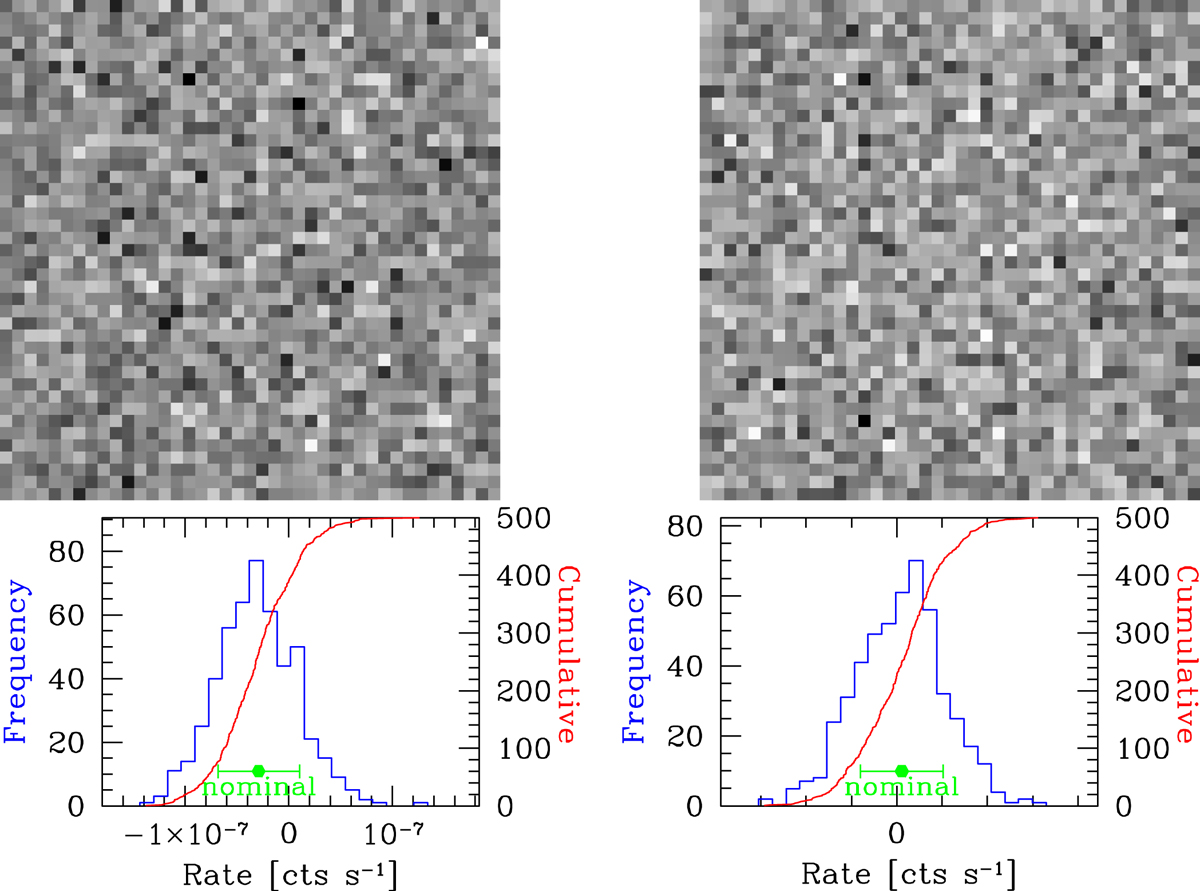
Null result of stacking X-ray images from the 4Ms CDFS data at LAE positions. The panels on the left refer to the soft band (0.3–2.0 keV), the ones on the right to the hard band (2.0–7.0 keV). Upper panels: stacked images, whichare 20″ × 20″ interpolated on a 0.5″ pixel size Chandra grid. Lower panels: statistics of the mean stack.
Current usage metrics show cumulative count of Article Views (full-text article views including HTML views, PDF and ePub downloads, according to the available data) and Abstracts Views on Vision4Press platform.
Data correspond to usage on the plateform after 2015. The current usage metrics is available 48-96 hours after online publication and is updated daily on week days.
Initial download of the metrics may take a while.