Fig. 10.
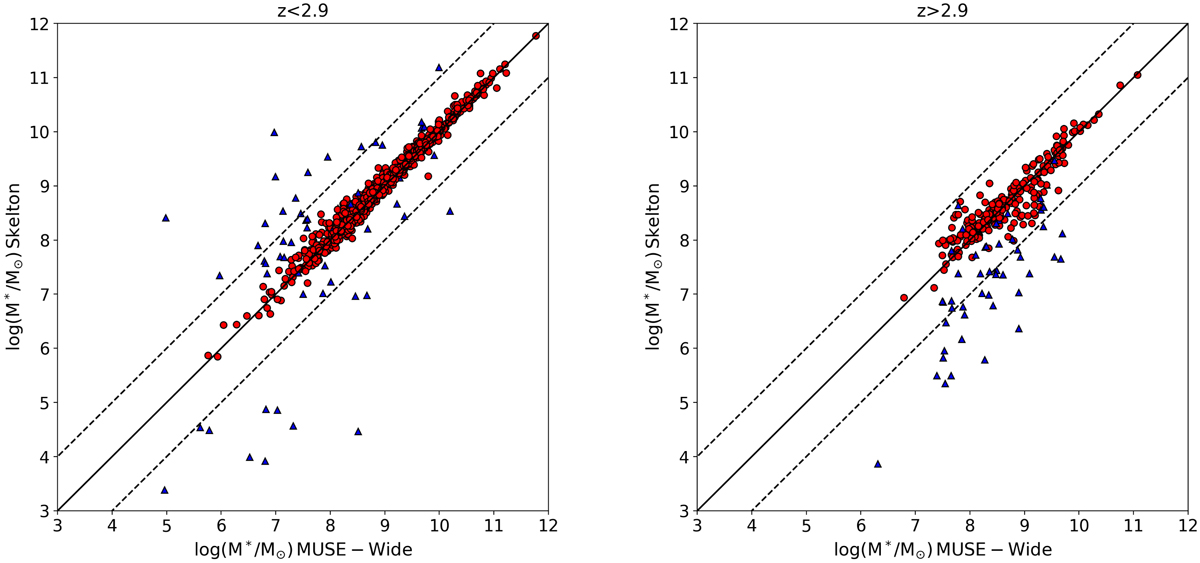
Photometric mass estimates fixed at the MUSE-Wide spectroscopic redshifts compared to the Skelton et al. (2014) photometric mass estimates based on photometric redshift estimates. The solid line represents the 1:1 mass equivalency, while the dashed lines show ±1 dex differences between the two stellar mass estimates. Marked with blue triangles are catastrophic redshift outliers, which will be the main cause of discrepancies. At low redshift there is good agreement between the stellar masses, while at high redshift the scatter between the masses is larger due to the large photometric errors associated with these faint galaxies.
Current usage metrics show cumulative count of Article Views (full-text article views including HTML views, PDF and ePub downloads, according to the available data) and Abstracts Views on Vision4Press platform.
Data correspond to usage on the plateform after 2015. The current usage metrics is available 48-96 hours after online publication and is updated daily on week days.
Initial download of the metrics may take a while.